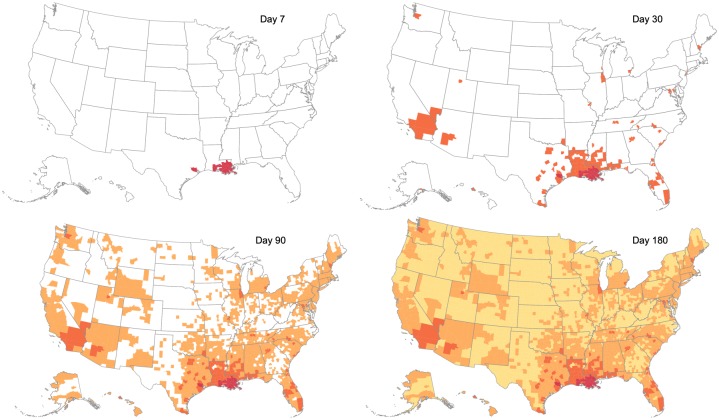
Fig 3. Model evolution.
Spatio-temporal spread of influenza, for a sample scenario, seeded in Louisiana. Counties where the epidemic emerges by Day 7, 30, 90 or 180 are respectively shaded in red, orange, brown and yellow. We observe that the evolution of influenza spread exhibits both spatially local spread (aided by the commuter flow), and long range transmission events (aided by the domestic airline flow). This is especially evident in the transition between Day 7 to Day 30, where the epidemic originally seeded in southern counties of Louisiana spreads to other neighboring counties, as well as far away counties which have major airport cities (such as Seattle, Chicago, DC).

