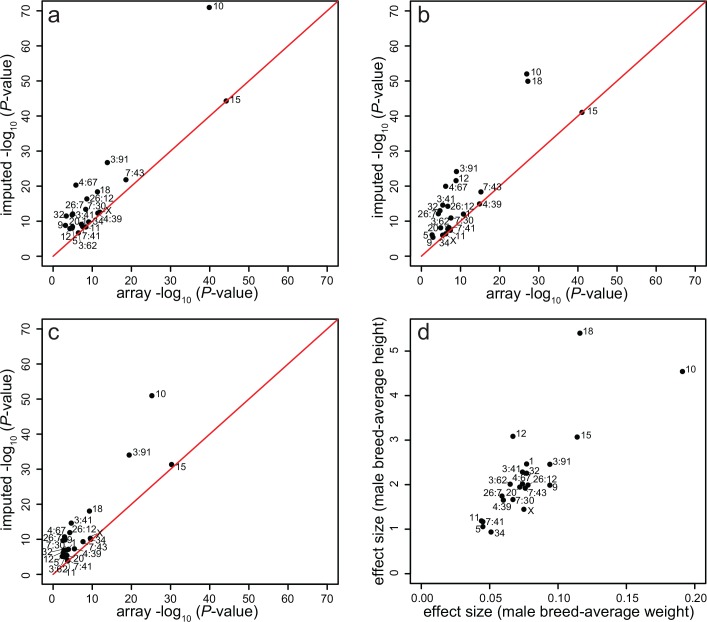
Fig 2. Scatter plots showing P-values and effect sizes for array vs imputed GWAS body size results.
P-values for array GWAS (x axis) and imputed GWAS (y axis) results for the 22 body size QTLs (as shown in Table 1) a) male breed-average weight, b) male breed-average height, c) individual sex-corrected weight, and d) absolute values of the effect sizes of the most-associated SNP for male breed-average weight and male breed-average height from the imputed GWAS.

