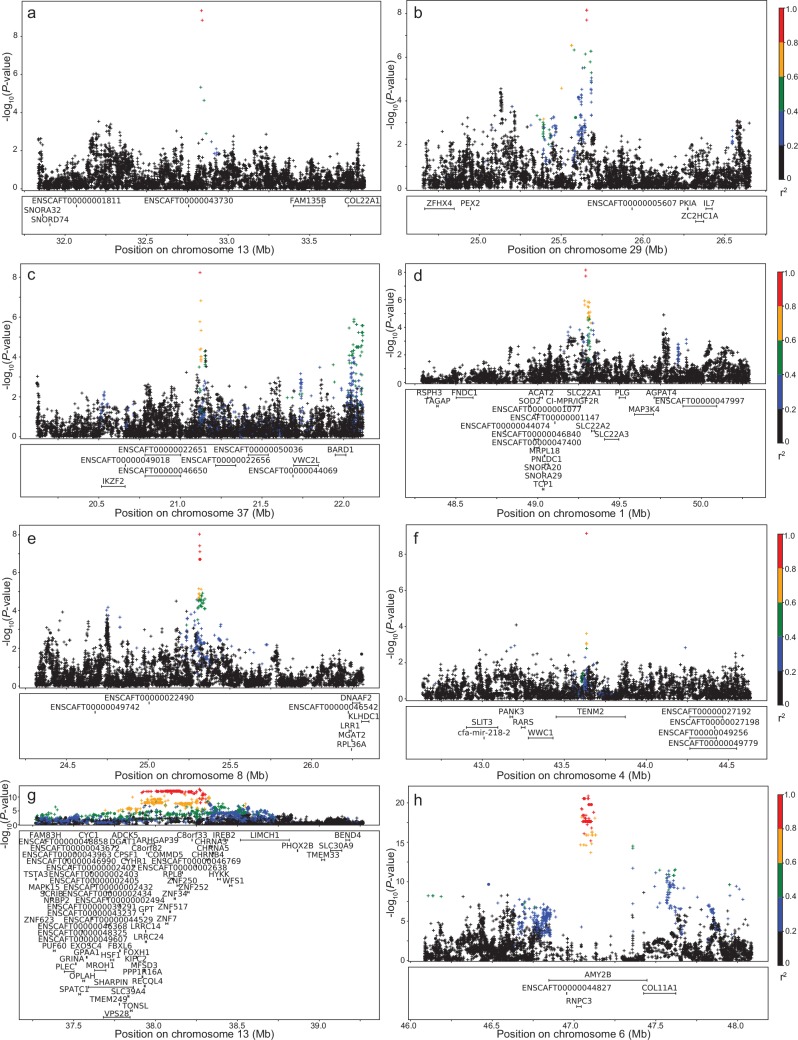
Fig 5. LD plots for significant blood phenotypes.
a) albumin on CFA13, b) anion gap on CFA29, c) calcium on CFA37, d) sqrt glucose on CFA1, e) potassium on CFA8, f) white blood cells on CFA4, g) log ALT on CFA13, h) sqrt amylase on CFA6. Array genotypes are shown as o, imputed data are shown as +. Colors indicate amount of LD with the most significantly associated SNP, ranging from black (r2<0.2) to red (r2>0.8).

