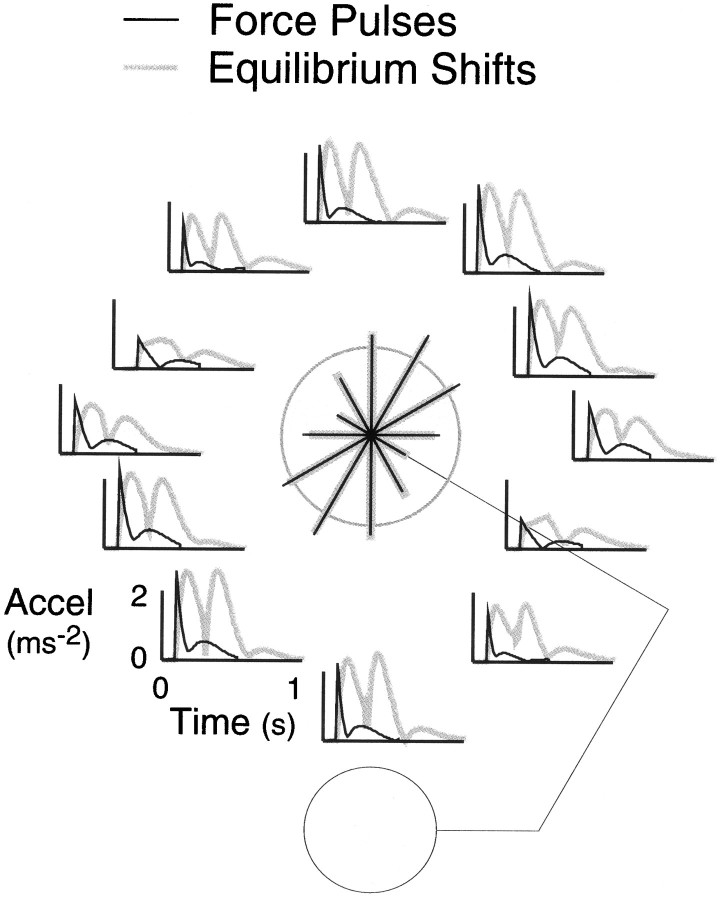
Fig. 1.
Simulated hand resultant acceleration profiles in response to force pulses (1.75 N for 0.9 sec) applied at the hand (black traces) or shifts (20 cm in 0.2 sec) in the equilibrium position of the hand (gray traces). A two-link planar arm model with single-joint and double-joint stiffness and viscosity terms was used (Flash, 1987). The initial position of the model arm, shown in the figure, matched the arm-centered condition. The polar plot in the center shows the initial peak in acceleration as a function of the direction of the applied force or equilibrium shift. The radius of the calibration circle is 2 m/sec2.

