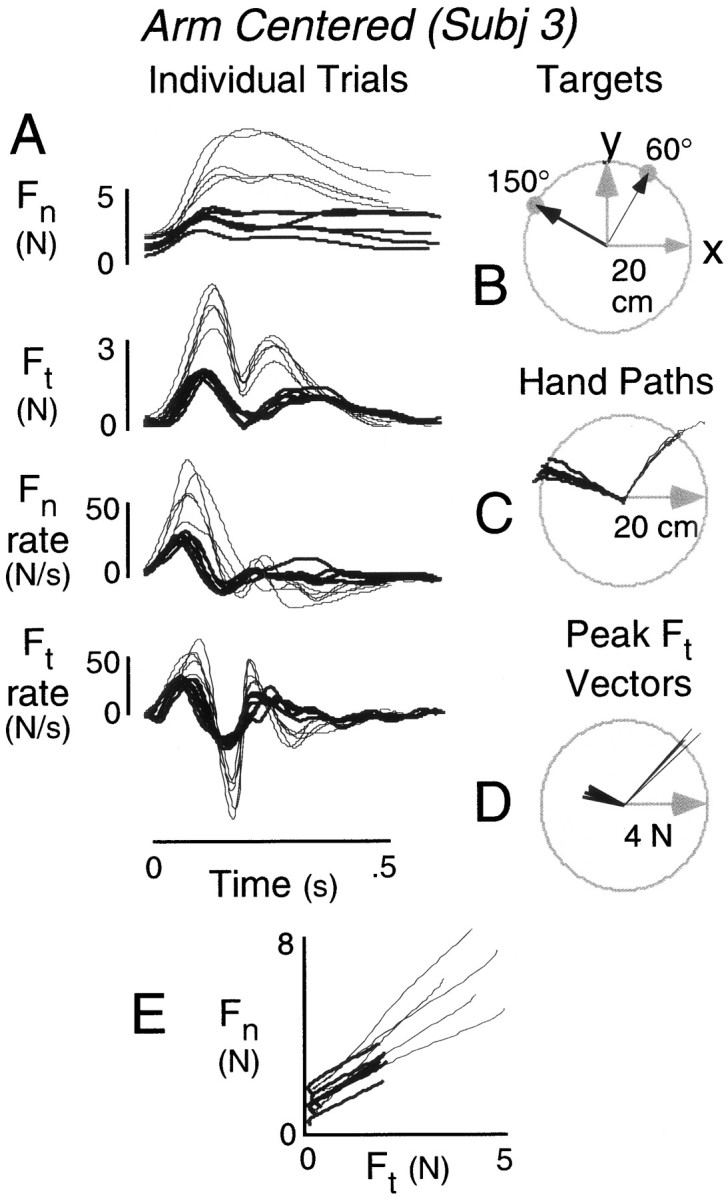
Fig. 4.

A, Normal (Fn) and tangential (Ft) force records and force rates from one subject for movements to the 150° (thick traces) and 60° (thin traces) targets (B). Five trials shown for each target. Data are from the arm-centered condition. C, Corresponding hand paths. D, Corresponding vectors representing initial peak tangential force (magnitude) plotted as a function of hand displacement (direction). Greater initial peak tangential forces were observed for movements to the 60° target. E, Normal force plotted as a function of tangential force from movement onset to the initial peak tangential force. Separate functions shown for each trial with thick and thin tracescorresponding to movements to the 150° and 60° targets, respectively.
