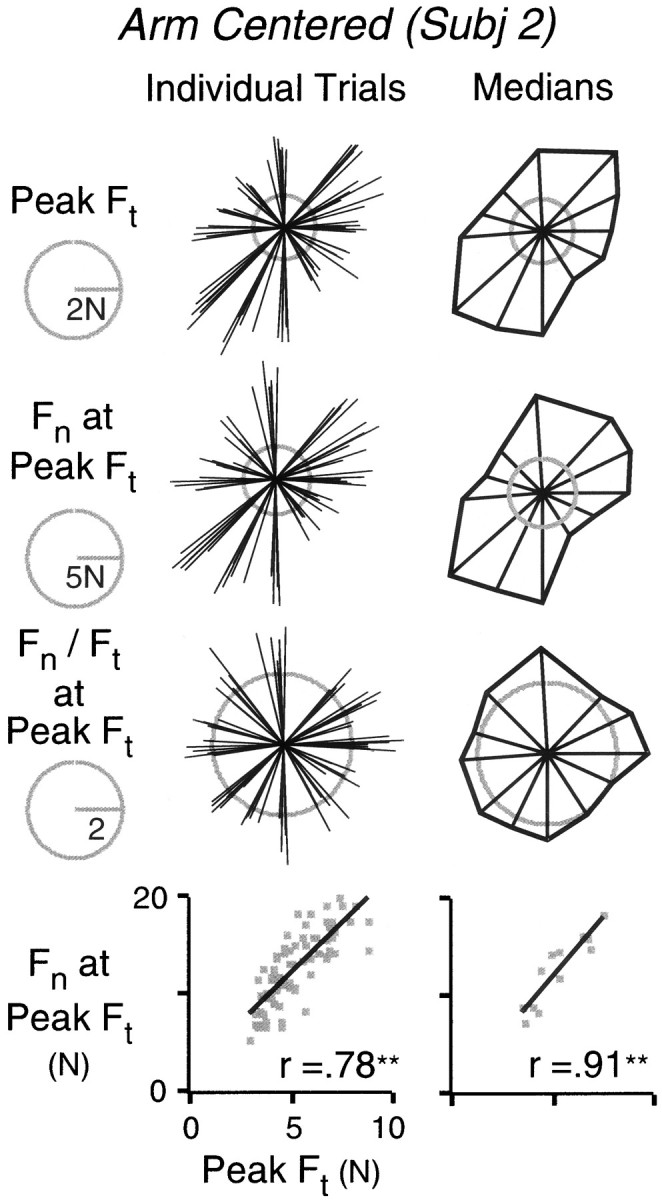
Fig. 5.

Top row, Polar plots representing initial peak tangential force (Ft) as a function of hand displacement direction. In the plot on the left, each vector represents a single movement, and all trials for a single subject are shown. In the plot on the right, each vector represents the median initial peak tangential force of the six movements directed to a given target. The direction of the each vector represents the median hand displacement of the same trials. The tips of the vectors are joined to provide an impression of the distribution. The second and third rows show corresponding plots for the normal force (Fn) and the ratio of normal force to tangential force observed at the time of initial peak tangential force. The bottom row shows the relationship between normal force, observed at initial peak tangential force, and initial peak tangential force. The relationships for individual trials and for median values are shown on the left andright, respectively.
