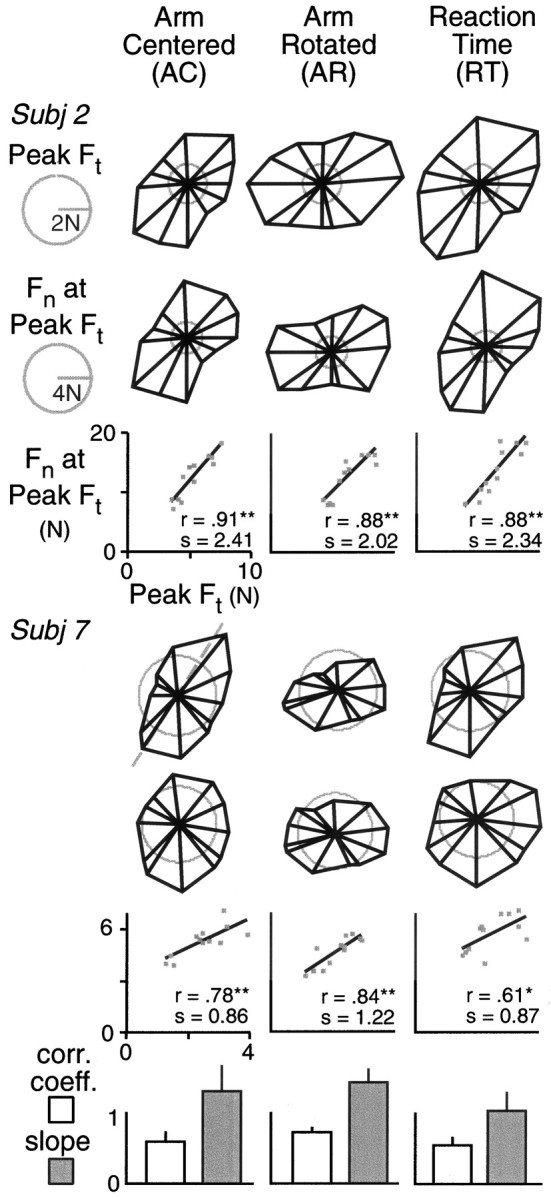
Fig. 6.

The polar plots in the top two rowsshow peak tangential force (Ft) and the normal force (Fn) at the time of peak tangential force for movements in different directions. Data shown are from one subject. Vector magnitude represents the median force for the six movements to each target, and the direction represents the median hand displacement. Separate plots are shown for each of the three experimental conditions. The third row shows normal force as a function of peak tangential force based on the median values. The correlation coefficients and slopes of the least-squares linear regression fits are indicated. The next three rows show corresponding results for a second subject. The bar graphs in the bottom row show the correlation coefficients and slopes (of the linear functions relating normal and peak tangential force) for each condition averaged across all 10 subjects. Error bars represent SEs.
