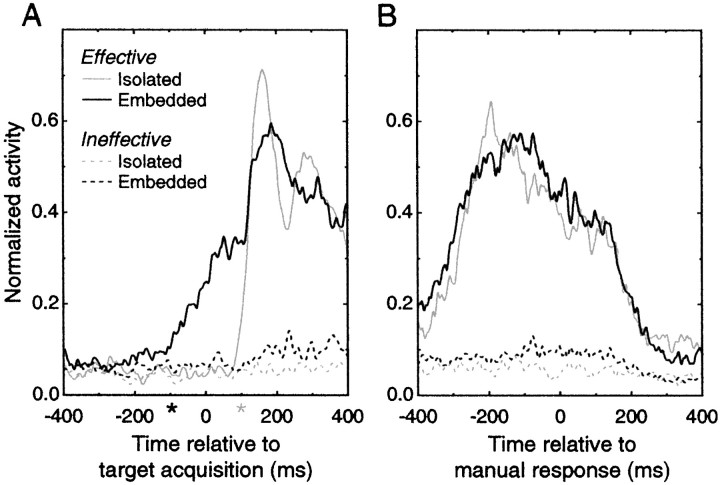
Fig. 6.
Population activity profiles.A, Average activity aligned on the time the monkey fixated within 1.5° of the center of the target. Averages comprise normalized activity estimates for each cell that exhibited significant selectivity for at least one target in both the isolated and embedded conditions (n = 32 cells). Dotted lines correspond to the response to ineffective targets in the isolated (gray) and embedded (black) condition, and both show little modulation compared with activity on trials containing the most effective target (solid lines). For the isolated trials, target acquisition time coincided with target appearance, whereas in the embedded trials, the monkey could acquire the target any time after the scene onset. The activity for all four conditions for each cell was normalized to the maximum of the activity estimate in the isolated/preferred (solid gray line) condition. The pilot kernel for all spike density estimates was 5 msec.B, Average activity aligned on the manual response time for the same conditions and cells shown in A. The difference between the effective (solid lines) and ineffective targets (dotted line) is clear, but no significant difference between the isolated (gray lines) and embedded (black lines) trials was observed.

