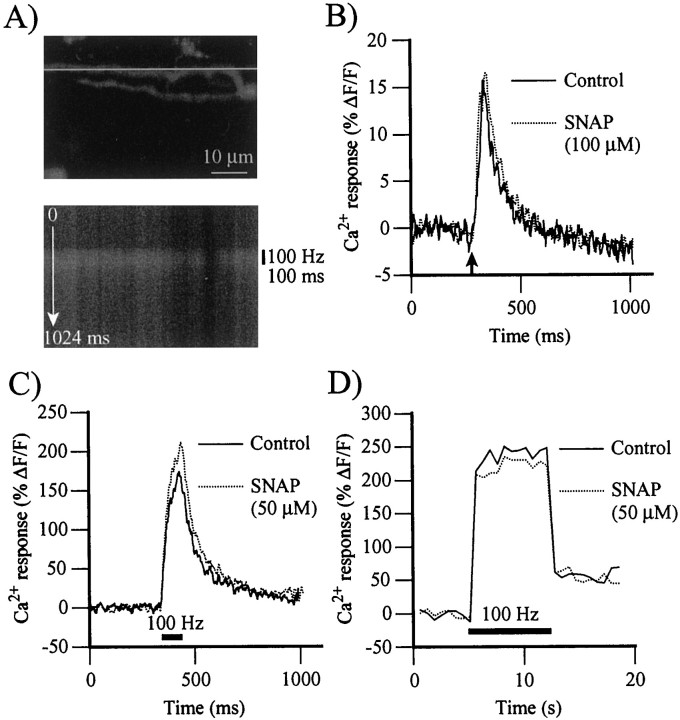
Fig. 3.
Effects of NO on stimulation-evoked Ca2+ responses in nerve terminals. Ca2+ responses were obtained using the line scan mode of the confocal microscope and monitored over a nerve terminal backfilled with Ca2+-green-1 dextran.A, Top, Gray scale confocal image of a branch of nerve terminal loaded with Ca2+-green-1 dextran. The line indicates the position of the line used to perform the line scan measurements. Bottom, Gray scale color image of the changes in fluorescence elicited by a brief train of stimuli (100 Hz; 100 msec) observed using the line scan mode of the confocal microscope. Black indicates a low level of Ca2+; white is a high level. Thetop of the image is time 0 msec; thebottom is time 1024 msec (512 lines at 2 msec intervals). Note the elevation in fluorescence induced by the stimulation (vertical bar on right).B, Time course of Ca2+ responses evoked by a single action potential in control (solid line) and after a 30 min exposure to SNAP (100 μm; dotted line). The arrowindicates the time of stimulation of the motor nerve. The peak and the duration of Ca2+ responses were unchanged in four experiments. C, Time course of Ca2+responses evoked by stimulation of the motor nerve (100 Hz; 100 msec) in control (solid line) and after a 30 min exposure to SNAP (50 μm; dotted line). Thehorizontal bar indicates the period of nerve stimulation. NO significantly raised the amplitude of Ca2+ responses in 10 experiments. D, Time course of Ca2+ responses evoked by prolonged stimulation of the motor nerve (100 Hz; 7 sec) in control (solid line) and after a 30 min exposure to SNAP (50 μm;dotted line). The horizontal barindicates the period of nerve stimulation. In 10 experiments, Ca2+ responses were unchanged in the presence of SNAP.

