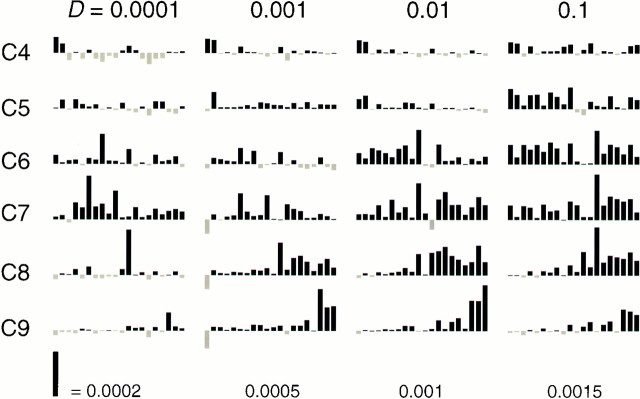
Fig. 4.
The pattern of activated glomeruli varies with odorant and with concentration. Optical responses of 20 glomeruli in a single olfactory bulb to aliphatic aldehydes of chain length 4 to 9 (C4,… , C9), presented at four different concentrations (D = 0.0001,… , 0.1, see Materials and Methods for the corresponding vapor concentrations). Each bar graph plots the absorption increase (black) or decrease (gray) for the 20 glomeruli. To better reveal the patterns at low concentrations, the vertical axis was normalized for each of the four concentrations, and the scale for the absorption change is indicated below each column of plots.

