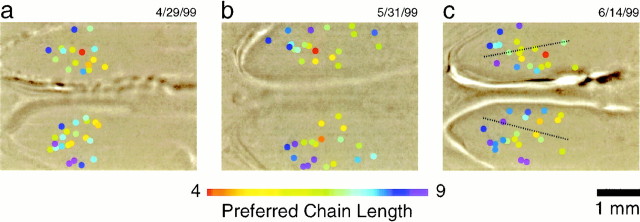
Fig. 6.
Response maps for aliphatic aldehydes.a–c, Results from three different rats. Each panel shows a faint image of the olfactory bulbs, along with the glomeruli responsive to this odor series. Each active glomerulus is marked with acircle and colored according to its preferred chain length. The dotted lines in c indicate a suggested line of symmetry within the bulb.

