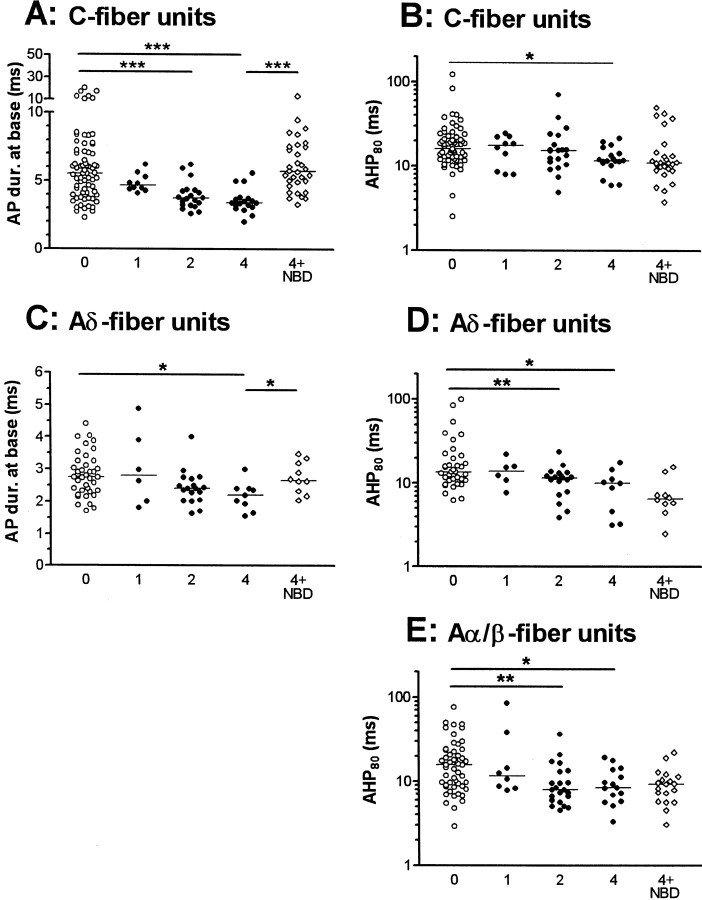
Fig. 3.
Effects of CFA and of NGF sequestration on AP variables in nociceptive neurons. Scatterplots to show effects in nociceptive neurons on AP and AHP duration where a significant change was found in response to CFA treatment. Each point shows the value for one neuron. For C fiber neurons AP duration (A) and AHP duration to 80% recovery (B) are shown, for Aδ units, AP duration (C) and AHP duration (D) are shown, and for Aα/β neurons only AHP duration (E) is shown. Statistical comparisons were made with the Kruskal–Wallis test between the 0, 1, 2, and 4 columns followed by Dunn's post-test comparing columns 0 and 1, 0 and 2, and 0 and 4. The 4 (CFA4D) and 4 + NBD (CFA4D plus NBD) columns were compared with the Mann–Whitney U test to establish if NGF sequestration reversed the changes seen 4 d after CFA.P values are indicated above the columns as follows: *p < 0.05; **p <0.01 and ***p < 0.001.

