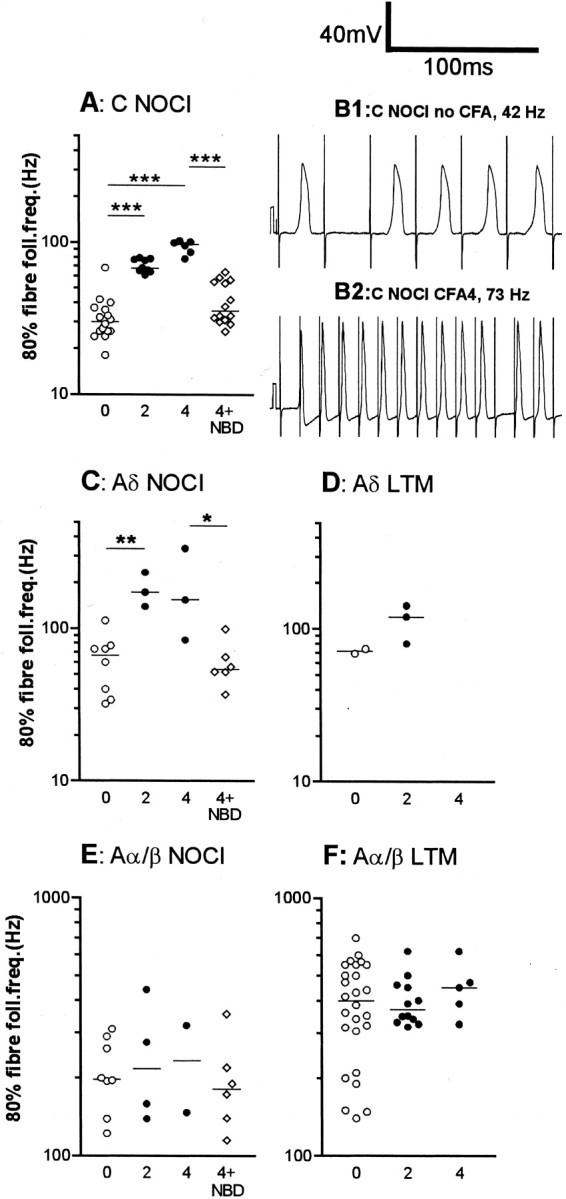
Fig. 4.

Effects of CFA and NBD treatments on fiber following frequencies. The median increase in 80% fiber following frequency (fiber FF80%) was highly significant (p < 0.0001) for C nociceptive units (A) both at 2 and 4 d after CFA. Examples of following frequency of C-fiber nociceptive units are shown in B1 (no CFA) and 2 (CFA4D). The fiber FF80% was significantly increased in Aδ nociceptive units at 2 d post CFA (C), and a nonsignificant increase remains at 4 d. There were not enough data points for comparison in the Aδ LTM units (D). There was no significant change in Aα/β-fiber nociceptive units (E) or in Aα/β-fiber LTM units (F). The abbreviation0 means no treatment (normal); 2 means CFA2D animals; 4 means CFA4D animals, and 4 + NBD means neurons from animals treated with CFA4D plus NBD. Medians are indicated by horizontal lines. Levels of significance between different groups are indicated byhorizontal lines connecting appropriate groups and asterisks (see legend to Fig. 2). Statistics were as described for Figure 3.
