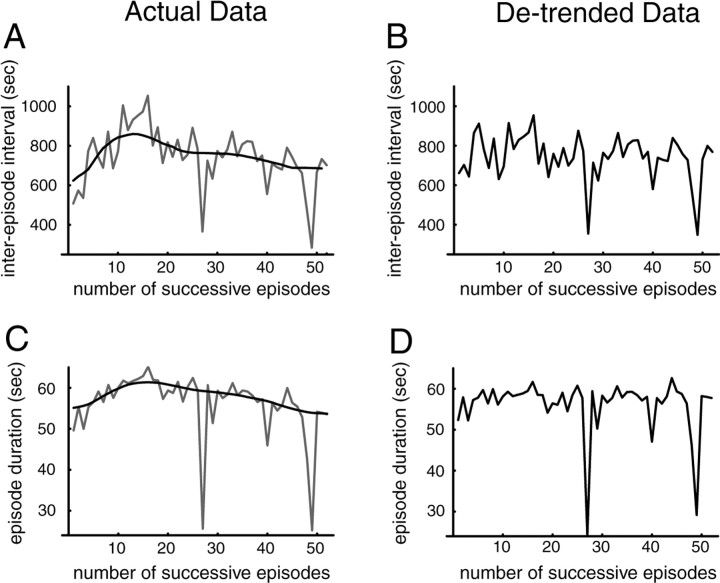
Fig. 1.
Data obtained from an E11 embryo illustrating the de-trending procedure. A, Graph of inter-episode interval; C, episode duration for each episode. The smoothed intervals and durations are superimposed. In this particular experiment, episode durations and inter-episode intervals increased and then decreased together, which would create a positive correlation between interval and duration. B, De-trended data, that is, subtraction of the smoothed data from the raw data (plus addition of the mean of the raw data) for the inter-episode intervals;D, episode durations.

