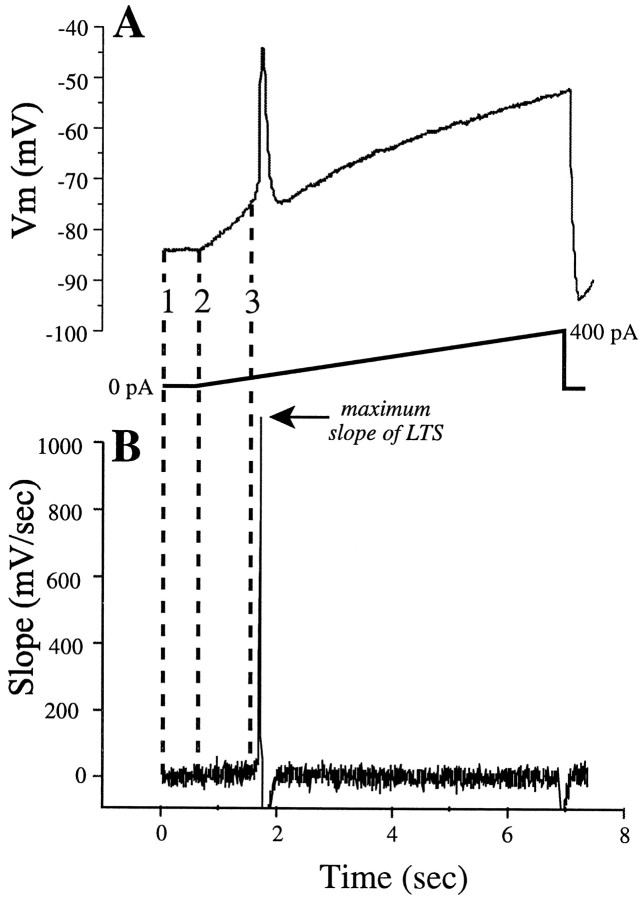
Fig. 2.
Determination of LTS threshold, LTS amplitude, and dV/dt. A, Voltage response (top trace) to injection of current ramp (bottom trace) to a cell in the presence of TTX. B, Differentiated voltage trace in A. The region bounded bylines 1 and 2 indicates the baseline response (in which no current was passed) and in which the upper 95% confidence limit was determined (see text for details). The LTS threshold was determined by extrapolating this confidence limit to the point at which 5 consecutive bins in the differentiated trace exceeded it. This point, indicated by line 3, provides the estimate of the LTS threshold. The slope (dV/dt) of the voltage response was then measured from the onset of the current injection (line 2) to the LTS threshold (line 3). Finally, the amplitude of the LTS was made by subtracting the voltage at the peak of the LTS by the voltage of the extrapolated gray lineunder the peak (arrows in A).

