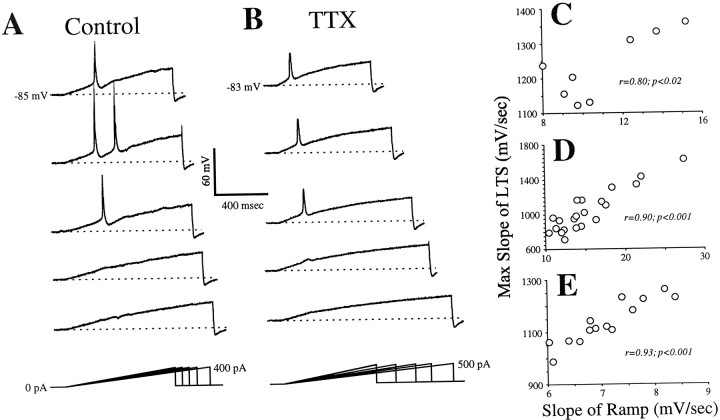
Fig. 3.
Voltage responses to ramps of injected current before and during TTX application. Conventions are as described in Figure 1. A, Responses before TTX application. Faster ramps (top 3 traces) activate LTSs, but slower ramps (lower 2 traces) do not. B, Responses during TTX application. Faster ramps (top 3 traces) activate LTSs, but slower ramps (lower 2 traces) do not.C, Relationship between LTS amplitude and depolarizing slope for data in B. D, E, Relationship between LTS amplitude and depolarizing slope for two other geniculate cells. Max, Maximum.

