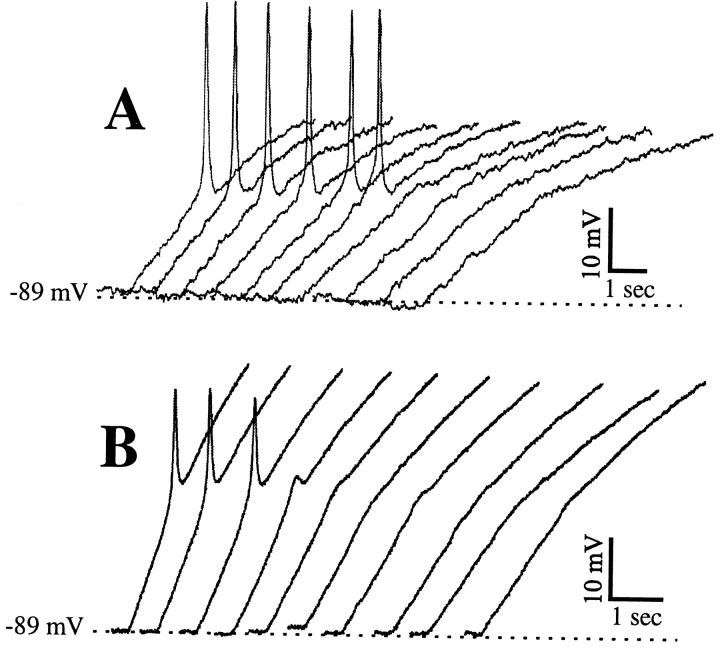
Fig. 4.
Responses of two different geniculate cells in TTX to injected ramps producing slower dV/dt values fromleft to right. A, Cell showing all-or-none LTS to faster ramps (6 traces on theleft) and no LTS to slower ones. B, Cell showing a partial LTS (4th trace fromleft) as a transition between all-or-none LTSs (3 traces on the left) and no discernable LTS (6 traces on the right).

