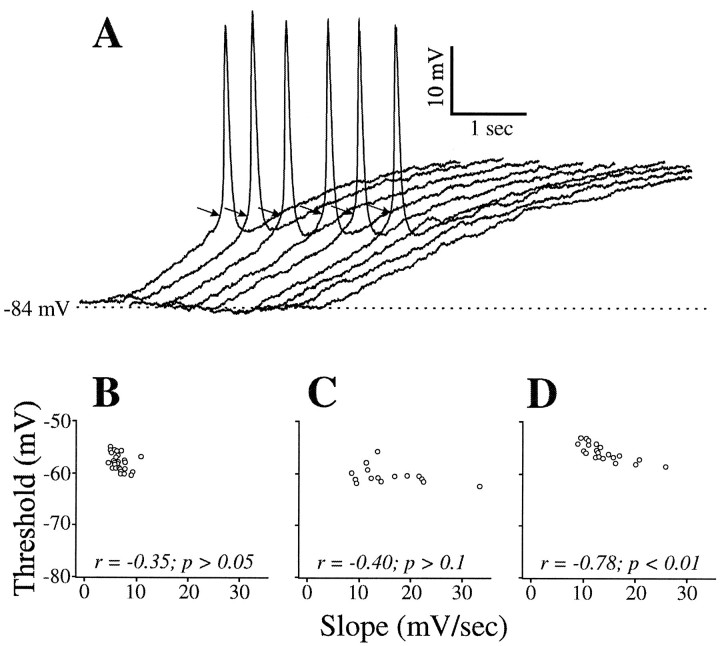
Fig. 5.
Reliability of LTS thresholds with different current ramps. A, Responses of a geniculate cell to injected current ramps producing lower dV/dt values fromleft to right. Arrowsindicate the threshold for each LTS (see Fig. 2 for how these were determined). B, Relationship between slope of the voltage ramp and threshold for activating the LTS for the cell illustrated in A. Only slopes fast enough to activate an LTS are considered. C, D, Plots as in Bfor two other geniculate cells.

