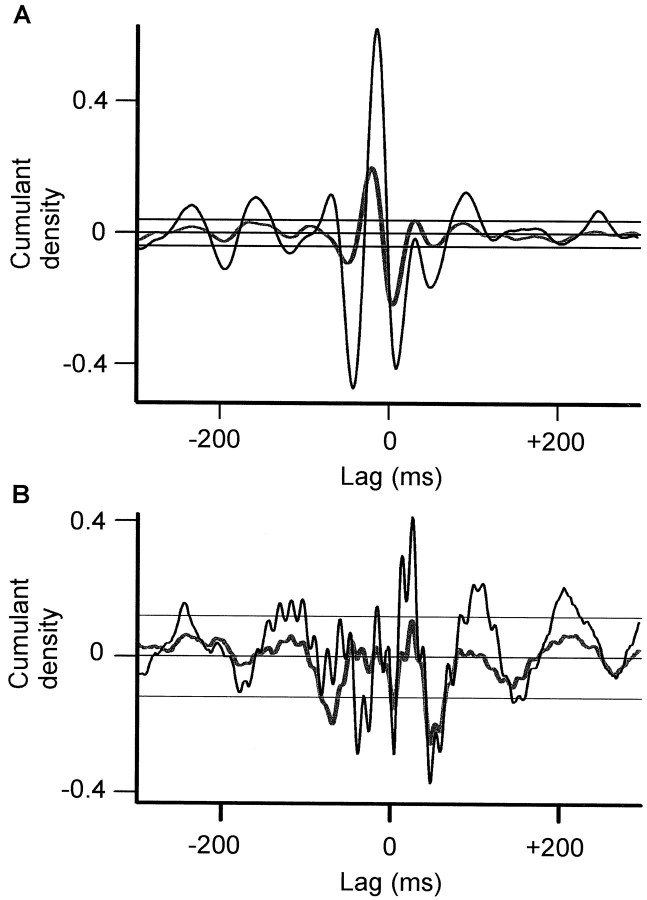
Fig. 4.
Cumulant density estimates after withdrawal (A) and reinstitution of levodopa (B) of levodopa recorded at rest.Black and thick gray lines are calculated from STN12–GPi12 and STN01–GPi12, respectively. STN01–GPi12 has been inverted. The close superimposition of waves indicates polarity reversal around contact 1 in STN for both the slow activity inA and fast (70 Hz) activity evident in B. The horizontal lines are the 95% CL.

