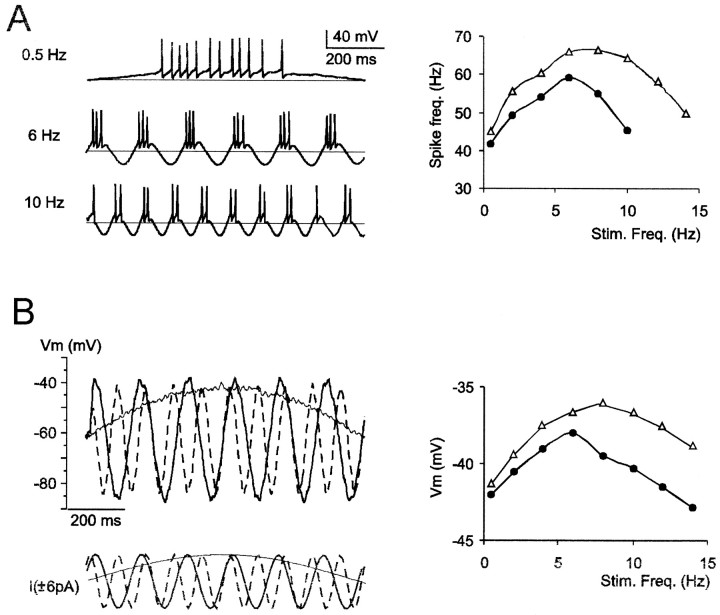
Fig. 2.
Resonance in a cerebellar granule cell (same cell as in Fig. 1A). A, Injection of sinusoidal currents at various frequencies (0.5–40 Hz) reveals resonance in burst spike frequency, which was measured by dividing the time period between the first and last spike in a burst by the number of interspike intervals. The plot shows that the resonance frequency was 6 Hz, with sinusoidal currents of ±6 pA (●) and 8 Hz with ±8 pA (Δ). At frequencies higher than those shown in the plot, just one or no spikes were generated, and spike frequency fell to zero. B, After 1 μm TTX perfusion, injection of sinusoidal currents at various frequencies reveals resonance in the maximum depolarization reached during the positive phase of the sinusoidal voltage response. The plot shows that the resonance frequency was 6 Hz, with sinusoidal currents of ± 6 pA (●) and 8 Hz with ±8 pA (Δ). Beyond the resonance peak, the sinusoidal voltage response decreased monotonically until 40 Hz (data not shown).

