
Fig. 5.
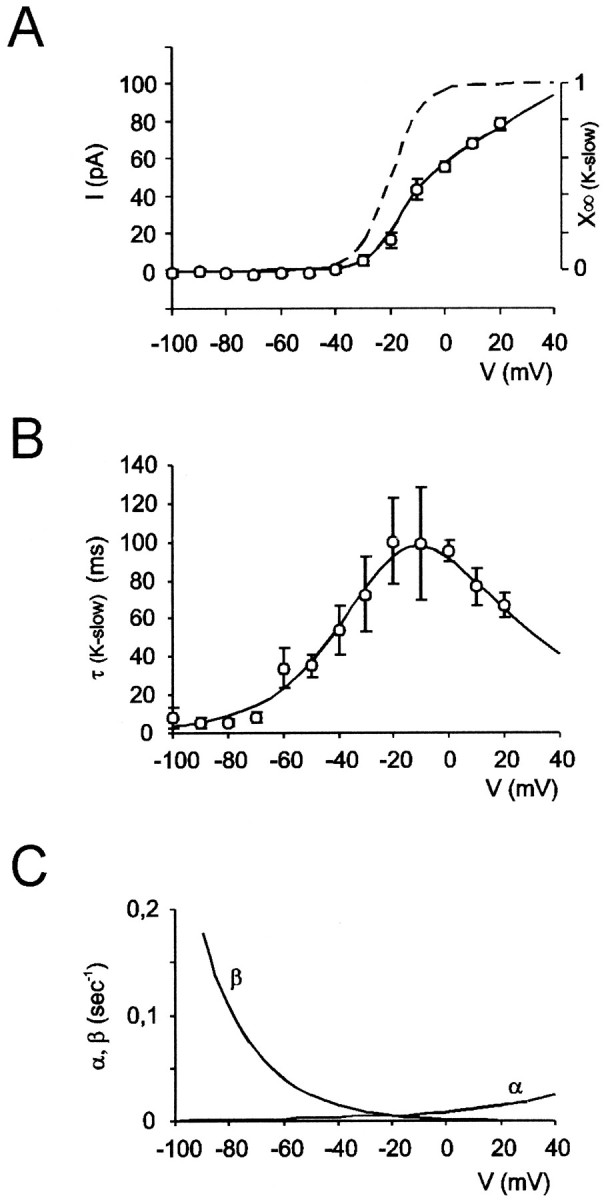
Gating properties ofIK-slow (average data from 9 granule cells, mean ± SEM). A, AverageI–V relationship (○) fitted with Equation 8 (solid line). The broken lineis the normalized steady-state activation curve (x∞(K-slow)) obtained with Equation 9. B, Average activation time constant (τ(K-slow)) versus membrane potential (○). The fitting line was obtained from Equation 4 and the kinetic functions shown inC. C, Voltage dependence of the kinetic constants α and β (see Eq. 3 and Table 1).