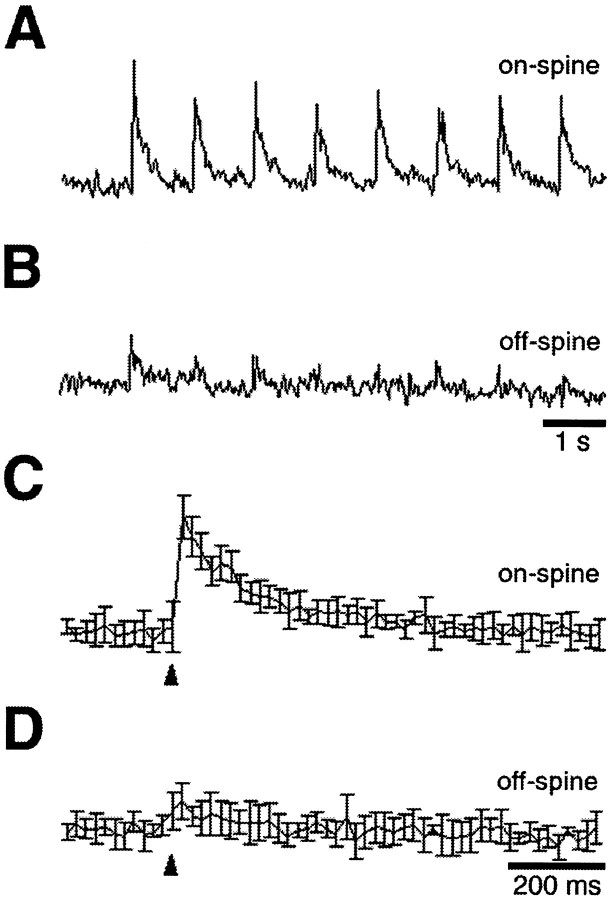
Fig. 2.
Time courses of synaptically driven calcium transients at identified sites on the postsynaptic neuron. The amount of calcium fluorescence in a 2.5-μm-diameter circle either overlying a spine mat (on-spine) or overlying part of the cell surface devoid of spines (off-spine) was quantified from a series of images collected continuously during synaptic stimulation at 1 Hz (18.5 msec/image). The cell that was analyzed was the same as that in Figure 1, and the on-spine and off-spine regions that were measured were those indicated by the arrow and arrowhead, respectively, in Figure 1G. A, Continuous imaging on-spine. B, Continuous imaging off-spine.C, Eight averaged responses from A. Error bars are shown for each individual time point. Thearrowheads indicate the time of stimulation.D, Eight averaged responses from B with the corresponding error bars. Synaptic stimulation at 1 Hz elicits calcium transients that reach maximum during the first 18.5 msec poststimulation and quickly return to baseline; they are confined mainly to the spine mat area because very little change is seen in the off-spine region. Similar results were obtained with 18 neurons that were tested. Calibration: A, B, 1 sec; C, D, 200 msec.

