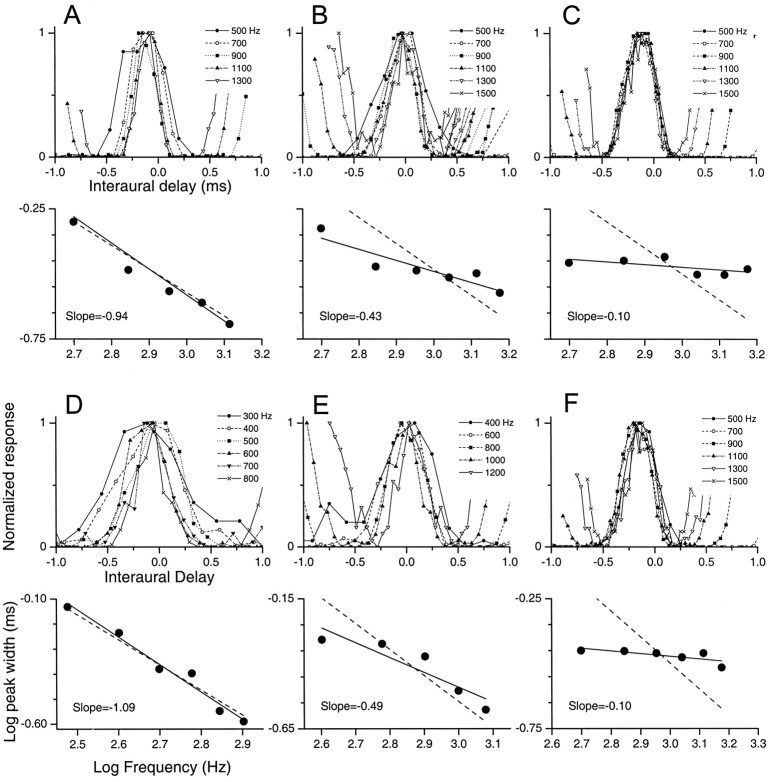
Fig. 1.
Examples of different forms of ITD tuning for peak-like neurons. A–F, For each neuron, the top panel displays the ITD functions across frequency, and the bottom panel plots log frequency versus log peak width (solid lines). Dashed lines in bottom panels are the predicted 1/f function (slope = −1). Responses of three IC neurons are shown in A–C, and an SOC neuron, a DNLL neuron, and an auditory cortex neuron are shown inD–F, respectively. A, D, Some neurons decreased their peak widths with frequency according to a 1/f relationship. B, E, Others also decreased their peak width with frequency but by less than that predicted by a 1/f relationship. C, F, Finally, some neurons displayed near-constant peak width with frequency.

