
Fig. 2.
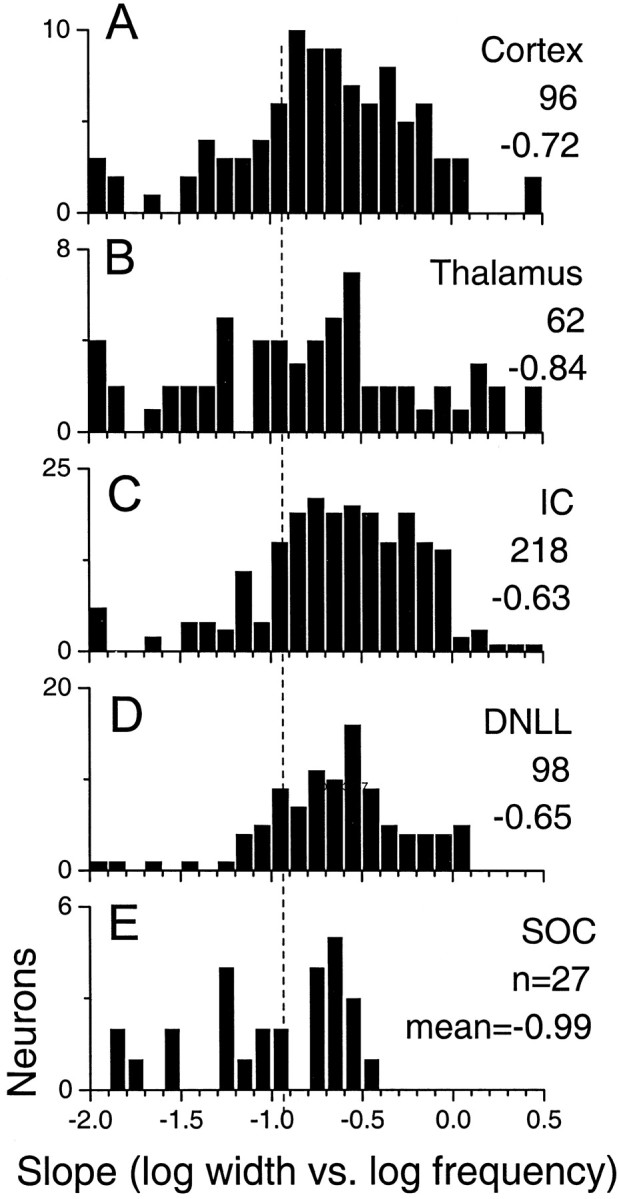
Distribution of the slopes of the log peak width versus log frequency function for peak-like neurons at different levels along the auditory pathway. The number of neurons and the mean slope for each level are indicated. The distributions, especially above the level of the SOC, are skewed to the right of a slope of −1 (dashed line), indicating that on average slopes are flatter than would be expected by a 1/frelationship.