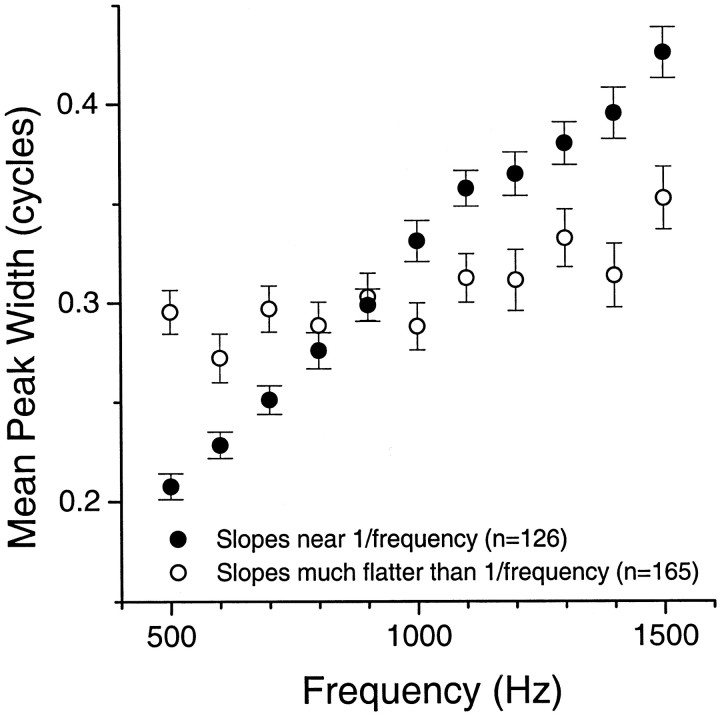
Fig. 3.
Mean peak widths in cycles as a function of frequency for two populations of neurons: those that had slopes (log width versus log frequency) that were near a 1/frelationship (i.e., ±0.25 of −1) and those that had slopes flatter than a 1/f relationship (greater than −0.5). Neurons were pooled from the DNLL, IC, auditory thalamus, and auditory cortex.

