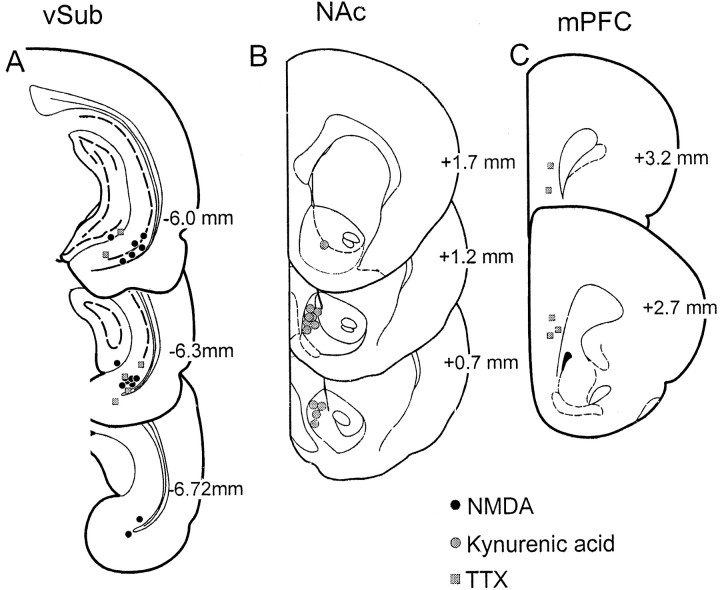
Fig. 1.
Histological verification of all recording and infusion sites in the present study. The location of infusions is shown for all rats receiving the following: A, infusions of 0.75 μg of NMDA (black circles) or TTX (gray squares) into the vSub; B, infusions of kynurenic acid into the NAc (gray circles); or C, infusions of TTX into the mPFC (gray squares). Plates are taken from Paxinos and Watson (1997), and the numbers beside each plate correspond to millimeters from bregma.

