
Fig. 3.
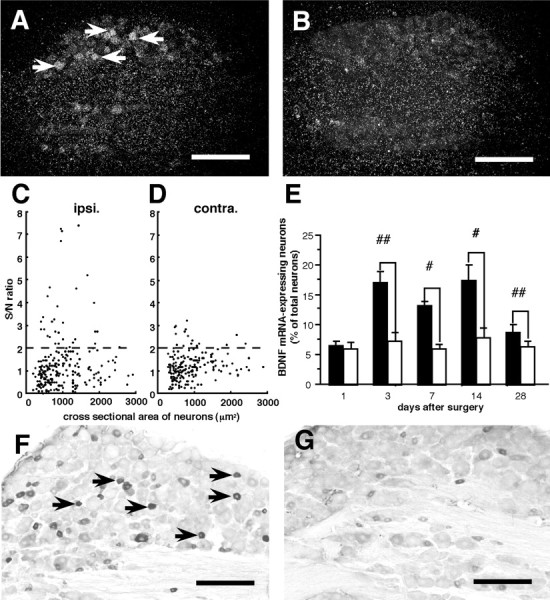
Effect of L5 spinal nerve ligation on BDNF protein and mRNA expression in L4 DRG neurons. A andB are dark-field photomicrographs showing in situ hybridization products for BDNF mRNA 14 d after surgery. In the ipsilateral L4 DRG (A), several neurons were intensely labeled (arrows) compared with the contralateral L4 DRG (B). Scale bars, 300 μm. C and D are scatterplot diagrams of BDNF mRNA expression in the ipsilateral (C, ipsi.) and contralateral (D, contra.) L4 DRG from one representative rat. Individual cell profiles are plotted according to the cross-sectional area (in square micrometers; along thex-axis) and S/N ratio (along the y-axis). The dashed lines indicate the borderline between the negatively and positively labeled neurons (S/N ratio = 2). A subpopulation of small (<600 μm2)- and medium (600–1200 μm2)-sized neurons showed an increase in S/N ratio on the ipsilateral side compared with the contralateral side. E is a bar graph showing means ± SEM (%) of BDNF mRNA-expressing neurons in the L4 DRG at various times after L5 spinal nerve ligation (n = 4 at each time point).Filled bars and open bars represent the values on the ipsilateral and contralateral sides, respectively. #p < 0.05; ##p < 0.01 by paired t test. F and G are photomicrographs of BDNF immunohistochemistry 14 d after surgery. On the ipsilateral side (F), the immunoreactive intensity of some small-sized neurons markedly increased compared with the contralateral side (G). Scale bars, 200 μm.