
Fig. 6.
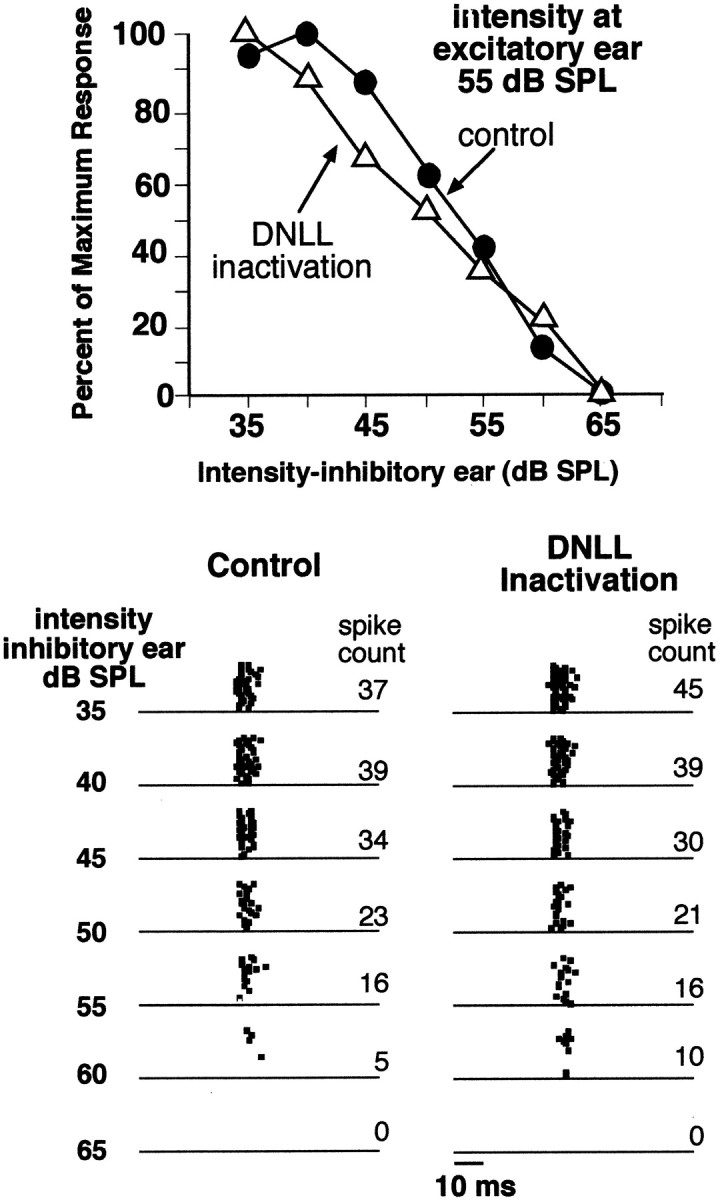
An ICc neuron that was not influenced by inactivation of the opposite DNLL. Bottom, Raster displays are shown of the responses evoked by binaural signals in which the intensity at the ear ipsilateral to the ICc (inhibitory ear) was increased by increments of 5 dB. Top, Suppression is plotted graphically. Here the suppression evoked by increasing ipsilateral intensities is plotted as the percentage of maximum response evoked. The functions obtained before (control) and during DNLL inactivation are similar, suggesting that the DNLL had little or no effect on the ipsilaterally evoked spike suppression in this cell. BF was 23.3 kHz.