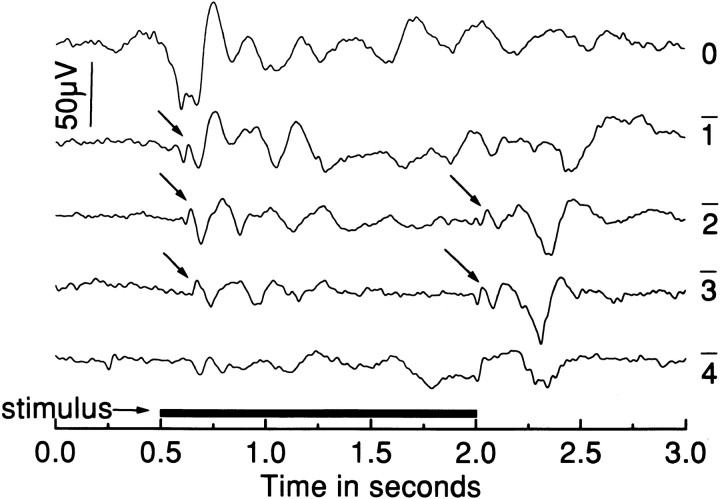
Fig. 4.
ERGs elicited with 1.5 sec light flashes from annrc mutant. Responses were recorded over 4 log units of intensity; log attenuation of the maximum flash intensity is indicated to the right of each trace. The initial ON b-wave and OFF d-wave (arrows) were small in amplitude. After both the b- and d-waves, additional waves were recorded. Often, as here, the additional waves that occurred after the d-wave in the mutant animals were as large or larger than those that occurred after the b-wave.

