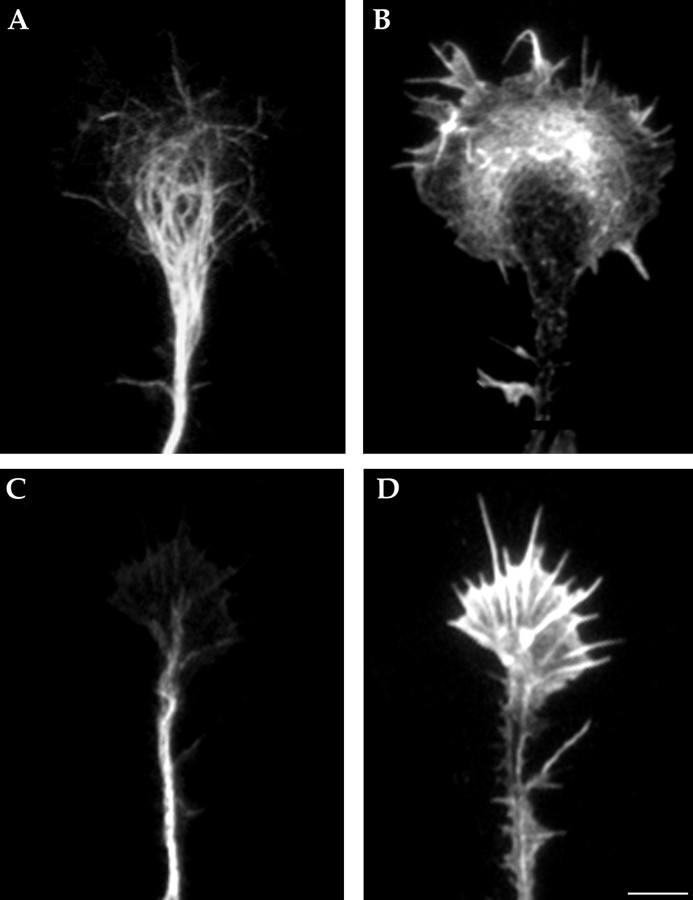
Fig. 6.
A, B, Double-immunofluorescence micrographs showing the morphology and cytoskeletal organization of a large growth cone of a sense-treated neuron. The culture was labeled with an mAb against tyrosinated α-tubulin (A) and rhodamine phalloidin (B). Note the large lamellipodial veil, the short actin ribs at the growth cone edge, and the penetration of microtubules within the central and peripheral growth cone region. C, D, Equivalent micrographs but from a culture treated with the AST1a oligonucleotide (2.5 μm). Note the small size of the growth cone, that microtubules end at its base (C), and that long F-actin (D) radial striations extend from the base of the growth cone toward its periphery. Scale bar, 10 μm.

