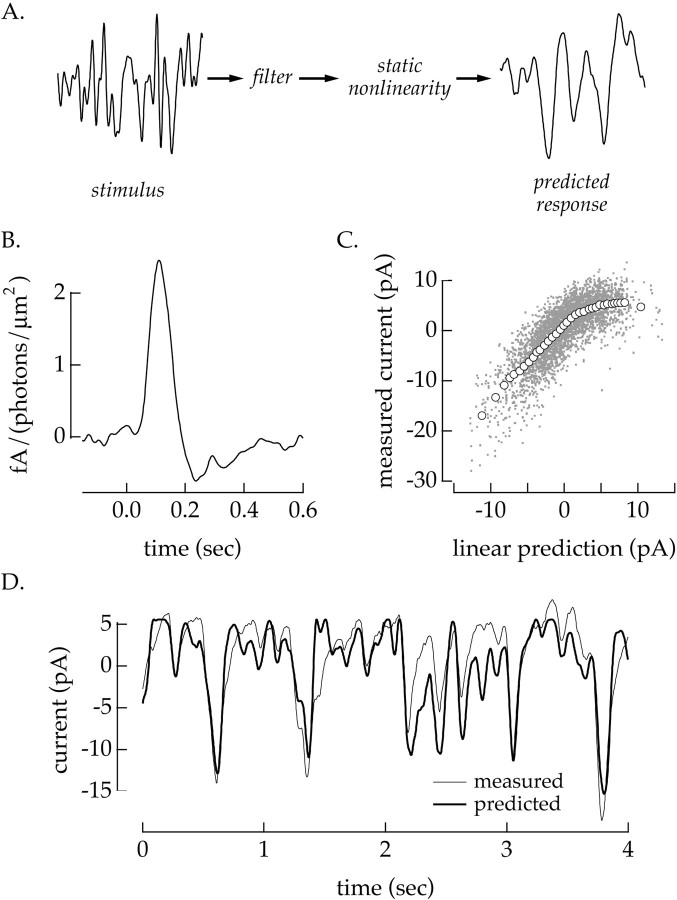
Fig. 1.
Static nonlinearity model. A, Schematic of model. The static nonlinearity model predicts the transformation between light intensity and ganglion cell response by first linearly filtering the light intensity and then passing the filter output through a static nonlinearity. This model was used to analyze the transformation from light stimulus to input currents in a ganglion cell (light-to-current). B, Linear filter (light-to-current) for a voltage-clamped off ganglion cell. The filter was calculated from Equation 3 from six 40 sec epochs during an 8% contrast light stimulus. The first 20 sec of each epoch were discarded from the calculation. C, Static nonlinearity corresponding to filter in B. Each of the dots represents a single comparison of the measured response and the linear prediction created by convolving the light input with the filter in B. The open circles plot the average of 120 adjacent points on the x -axis. Error bars (SEM) are obscured by the markers. D, Section of measured and predicted response to an 8% contrast light stimulus. The thin trace plots the average current response to 20 repetitions of the same random contrast signal. The thick trace is the predicted response from the static nonlinearity model using the linear filter and static nonlinearity shown in B and C. The responses used to generate the thin trace were not used in the calculation of the linear filter and static nonlinearity to guard against overfitting. Mean light intensity: 4300 photoisomerizations/sec per L cone; holding potential: −60 mV.

