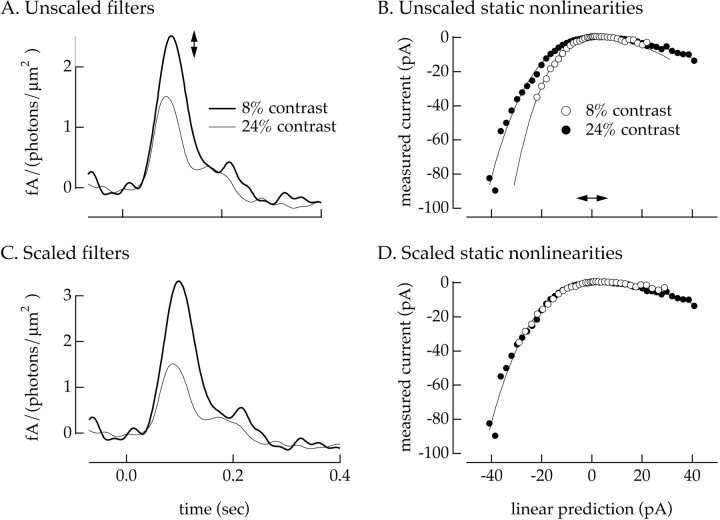
Fig. 3.
Use of static nonlinearity model to study contrast adaptation. Light-evoked currents were recorded from anon/off ganglion cell during interleaved 8 and 24% contrast inputs. A, Linear filters calculated from Equation 3. B, Static nonlinearities calculated as in Figure1C. The smooth curve fit to the low-contrast static nonlinearity is a best fit quintic polynomial. The x -axis scaling of this curve was varied to fit the high-contrast static nonlinearity. C, Scaled linear filters. The filter at low contrast has been multiplied by 1.3, a factor chosen to produce the best overlap of the static nonlinearities from B. D, Scaled static nonlinearities. The x -axis of the low-contrast static nonlinearity has been expanded by a factor of 1.3, corresponding to the scaling of the linear filters in C. Mean light intensity: 8500 photoisomerizations/sec per L cone; holding potential: −60 mV.

