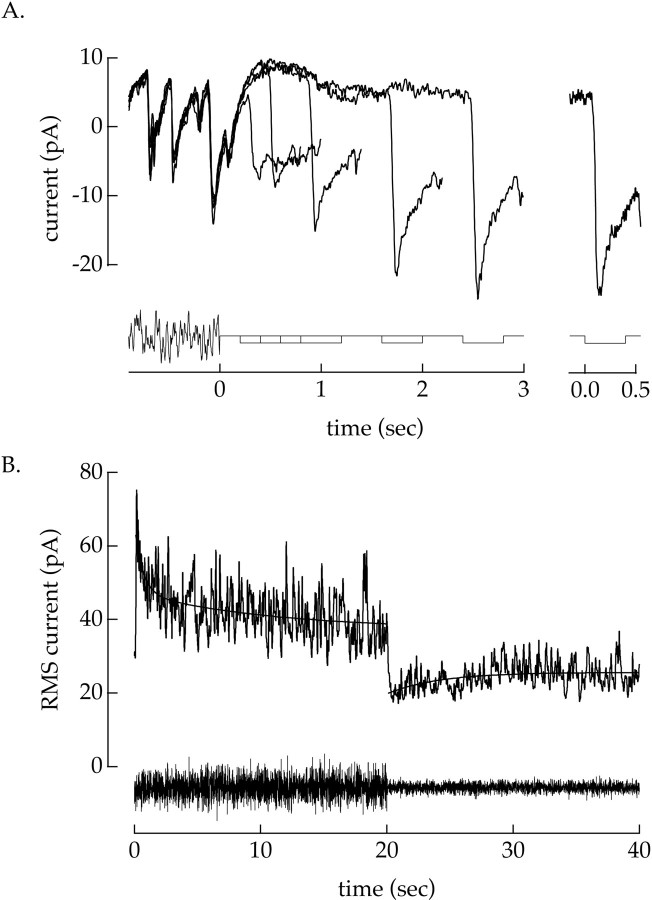
Fig. 5.
Time course of onset and offset of contrast adaptation. A, Recovery of the sensitivity of anon/off ganglion cell after an adapting contrast signal. A 21% contrast stimulus was presented for 10 sec. At time 0, modulation of the light ceased, whereas the mean light intensity remained constant. After a variable delay, a 15% L cone-isolating light decrement lasting 400 msec was delivered (see timing trace). Average responses to this stimulus for each delay are superimposed, with the response to the light decrement in the absence of the adapting contrast signal at the far right. Mean light intensity: 2600 photoisomerizations/sec per L cone; holding potential: −60 mV. B, Onset and recovery of contrast adaptation for continuous stimuli. The contrast of the light input was switched between 8 and 21% every 20 sec. The time-dependent RMS current response from 14 statistically independent stimuli of this type is plotted; the RMS current provided a measure of the change in the amplitude of the response of the cell after a change in contrast (see Results). RMS values at each time point were calculated across the 14 stimulus repeats, and the resulting trace was smoothed with a sliding 200 msec time window. At time 0, the contrast increased from 8 to 21%. After an initial increase, the RMS current gradually declined during the subsequent 20 sec. The smooth curve fit to the decline in RMS current after the increase in contrast is a sum of two exponentials with time constants of 0.6 and 11 sec. At 20 sec the contrast decreased from 21 to 8% and the RMS current steadily increased. The smooth curve fit to the increase in RMS current after the decrease in contrast is a single exponential with a time constant of 4 sec. Mean light intensity: 2900 photoisomerizations/sec per L cone; holding potential: −55 mV.

