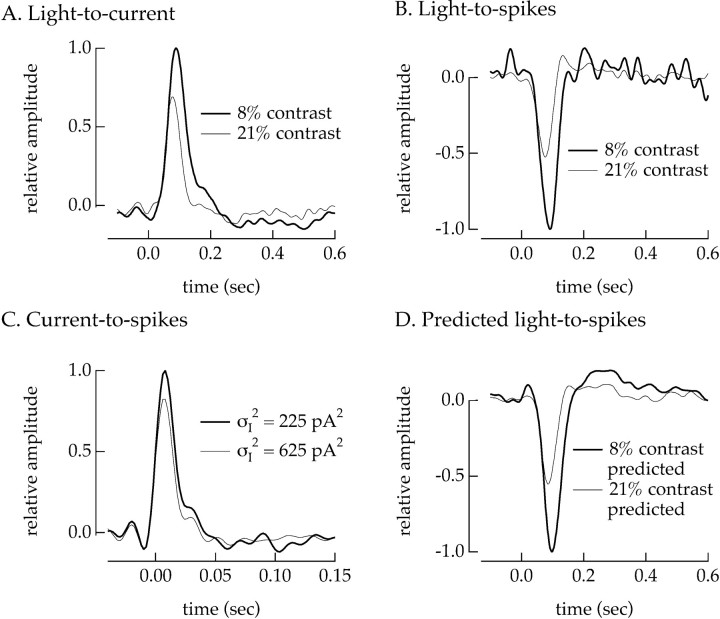
Fig. 9.
Changes in sensitivity of spike generation contributed to contrast adaptation. All measurements are from the same off ganglion cell. A, Linear filters describing the transformation of light intensity to ganglion cell input currents for 8% (thick trace) and 21% contrast (thin trace). Input currents were measured under voltage clamp. B, Linear filters describing the transformation of light intensity to output spikes for 8% (thick trace) and 21% contrast (thin trace). The peak amplitude of the filter at 21% contrast is 0.52 ± 0.01 times that at 8% contrast. Spike outputs were measured under current clamp. C, Linear filters describing the transformation of injected currents to spike outputs for Gaussian currents with variances of 225 pA2(thick trace) and 625 pA2 (thin trace). Current variances were chosen to match those of the input currents measured for 8 and 21% contrast light signals. The peak amplitude of the filter at 625 pA2 variance is 0.82 ± 0.01 times that at 225 pA2 variance. Bandwidth of injected current: 0–50 Hz. D, Predicted linear filters for 8 and 21% contrast. The filters and static nonlinearities describing adaptation in the input currents (A) and in spike generation (C) were used to predict contrast adaptation in the spike output. The amplitude of the predicted filter at 21% contrast was 0.55 ± 0.02 times that at 8% contrast, very similar to the measured effect of contrast shown in B. Holding potential in voltage clamp: −55 mV; holding current in current clamp: 40 pA. Mean light intensity: 4300 photoisomerizations/sec per L cone.

