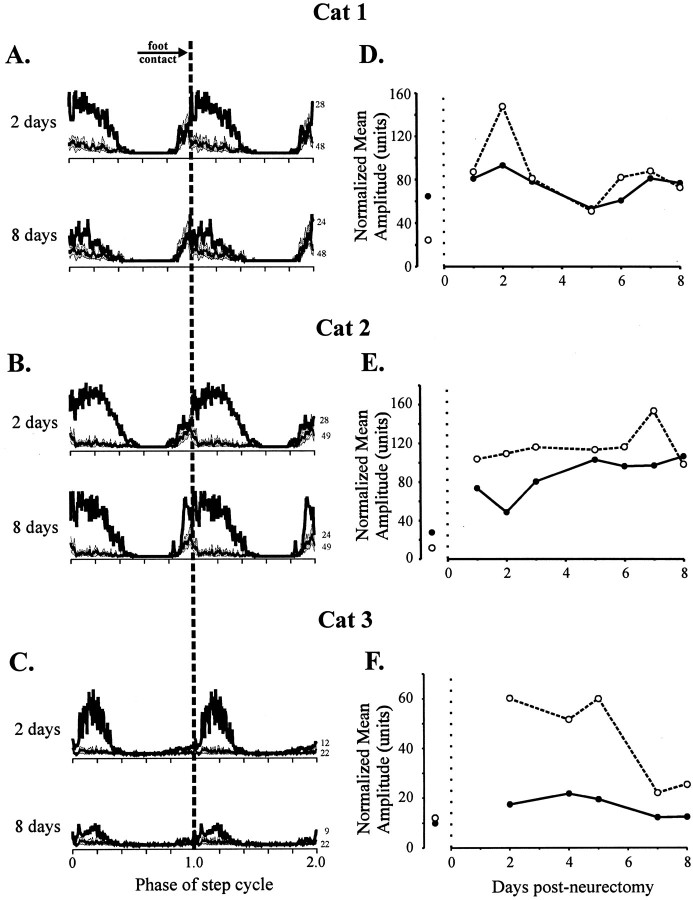
Fig. 6.
A–C, Average rectified EMG envelopes of the MG muscle, early (2 d) and late (8 d) after the neurectomy in dark traces compared with control ± SEM in gray traces. D–F, Time course of changes in precontact (closed circles) and postcontact (open circles) EMG as a function of time after the LGS neurectomy.

