Fig. 4.

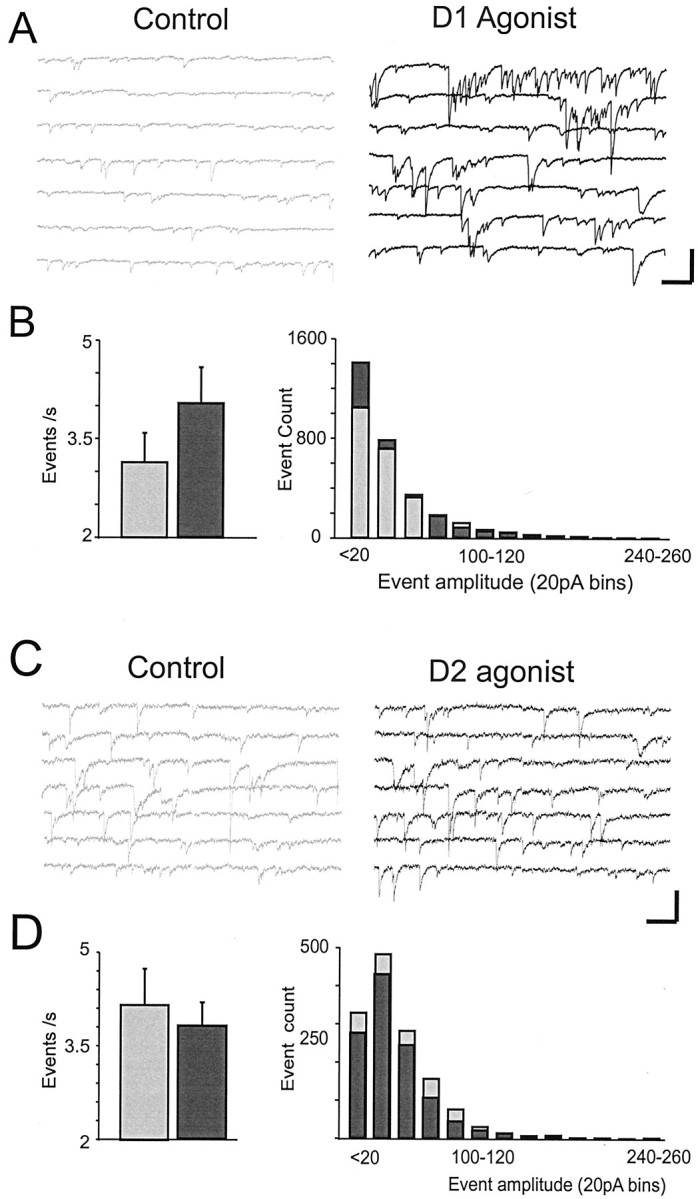
Dopamine agonist modulation of sIPSCs.A, Representative traces showing that the D1 agonist (black, right) increased the frequency of sIPSCs relative to the control condition (gray,left). Responses were recorded using CsCl- and QX-314-filled electrodes in the presence of APV and CNQX. Calibration: 100 pA, 600 msec. B, Left, Histogram of sIPSC frequency generated from all cells sampled for a 5 min period before D1 agonist application and for a 5 min period 10 min after D1 agonist application. D1 agonists increased sIPSC frequency.Right, Histogram from all cells showing the number of events in 20 pA bins for the control condition (gray bars) versus the D1 agonist condition (black bars). C, Representative traces showing sIPSCs in the control condition (gray,left) and after application of the D2 agonist (black, right). D,Left, Histogram of sIPSC frequency generated from all cells sampled for a 5 min period before D2 agonist application and for a 5 min period immediately after D2 agonist application.Right, Histogram from all cells showing the number of events in 20 pA bins for the control condition (gray bars) versus the D2 agonist condition (black bars). D2 agonists had no significant effects on sIPSCs.
