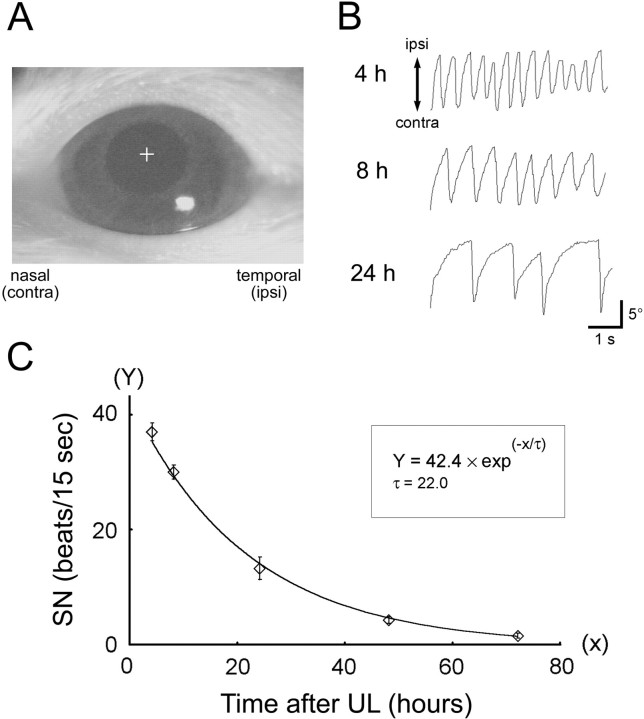
Fig. 1.
Measurement of SN after UL as an index of vestibular compensation. A, View of the rat eye on a computer monitor. The left eye of a labyrinthectomized rat was illuminated by infrared light, and its reflection was monitored through a CCD camera in darkness. The trajectory of the center of the pupil (indicated by the cross) was traced by a computer-aided, position-analyzing system. B, Representative traces of eye movements at 4, 8, and 24 hr after UL. The frequency of the quick phase of SN, which was a rapid, large-amplitude eye movement contralateral to the lesion side, was measured and plotted in C. C, Time course of disappearance of SN frequency after UL. Eachdata point represents the mean number of SN quick-phase movements in 15 sec across seven animals. The solid linerepresents a single exponential function with a time constant (τ) of 22.0 hr fitted by least-squares regression (R2 = 0.998). Error bars represent SEM.

