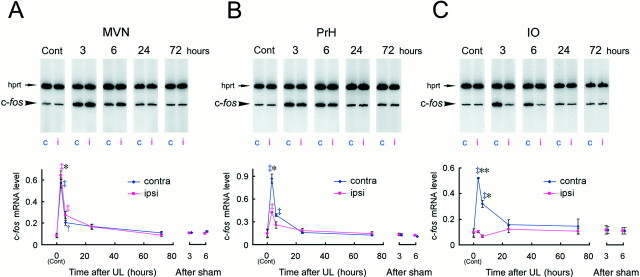
Fig. 6.
Time course of c-fos mRNA induction after UL. Induction of c-fos mRNA was evaluated by RT-PCR coamplification in the MVN (A), PrH (B), and IO (C). The c-fos mRNA levels normalized by the internal standard were plotted as in Figure 4. For the MVN (A), the two-way ANOVA revealed significant effects of survival time (p < 0.0001), laterality (p < 0.005), and interaction of survival time and laterality (p < 0.001). For the PrH (B), the ANOVA showed significant effects of survival time (p < 0.0001), laterality (p < 0.0001), and interaction (p < 0.0001). The ANOVA for the IO (C) also indicated significant effects of survival time (p < 0.005), laterality (p < 0.0001), as well as interaction (p < 0.0001). Daggersrepresent statistical significance of the difference relative to the mRNA expression level in the control rats (Duncan's post hoc multiple comparison; †p < 0.05; ‡p < 0.01), and asterisks denote a significant difference between the ipsilateral and contralateral sides (a post hoc paired t test; *p < 0.05; **p < 0.01). The c-fos mRNA levels in the sham-operated animals at 3 and 6 hr were also presented on the right side of each graph.

