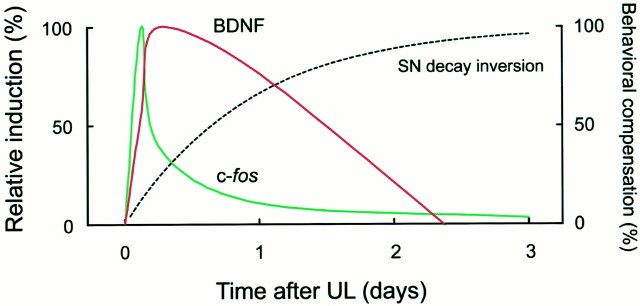
Fig. 8.
Schematic diagram of the temporal relationship between gene induction and vestibular compensation after UL. The time courses of BDNF and c-fos induction are depicted schematically according to the relative induction levels averaged among the ipsilateral MVN and the contralateral PrH and IO. The relative induction levels were calculated by normalization with the peak values after subtraction of the basal expression levels (left ordinate). The curve for behavioral compensation was drawn based on the inversion of the exponential function fit to the SN recovery, with an asymptote of 100 (right ordinate).

