Fig. 3.
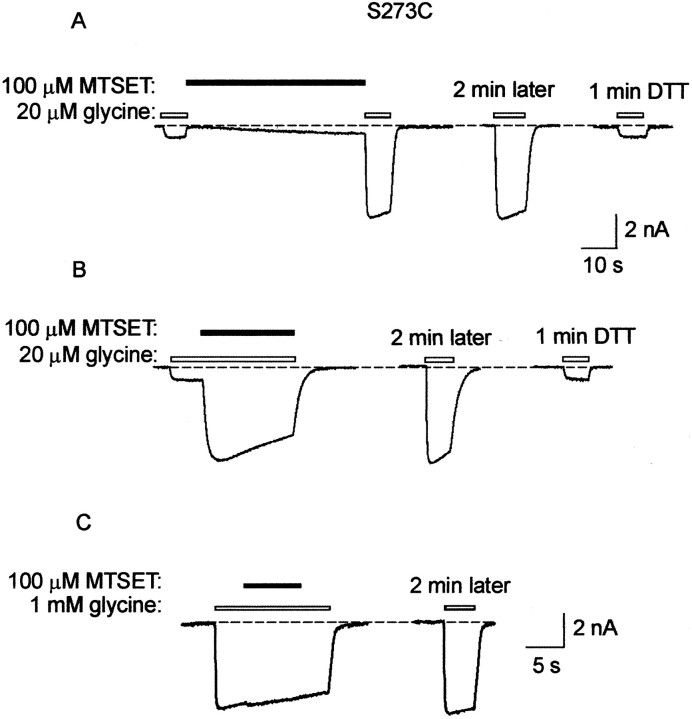
Effect of MTSET on the S273C mutant GlyR.A, All traces in A andB were recorded sequentially from the same cell in the presence of 20 μm glycine. This glycine concentration corresponds approximately to the EC20. The left trace shows the effect of an ∼50 sec application of 100 μm MTSET alone. The center trace shows that the current increase remains after a 2 min wash in standard bathing solution. The right trace shows that a 1 min wash in 1 mm DTT solution returns the current magnitude to the control level. B, The left traceshows the effect of applying MTSET in the presence of glycine. Thecenter trace was recorded after a 2 min wash in standard bathing solution, and the right trace was recorded after a 1 min exposure to 1 mm DTT. C, Theleft trace shows that when glycine is applied at a saturating (1 mm) concentration, there is no effect of MTSET on peak current magnitude. The right trace is a control recorded after a 2 min wash in standard bathing solution.

