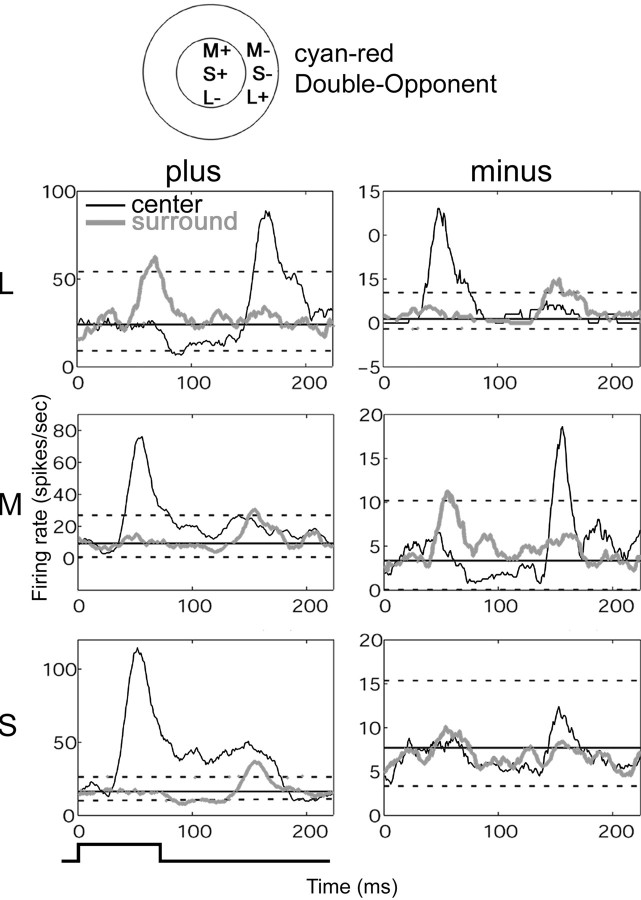
Fig. 7.
Temporal organization of a cyan–red Double-Opponent cell. Poststimulus time histograms corresponding to stimulation in the center (black traces) and surround (gray traces) for the plus stimuli (left plots) and minus stimuli (right plots) generated from the reverse correlation data (conventions as in Fig.5C). A normalized mean firing rate was calculated based on the first 40 msec (straight solid lines); one SD below and two above are plotted as reference (straight dotted lines). The cell was excited when an M-plus stimulus was presented in the center (middle left plot, black trace) and suppressed when an L-plus stimulus was presented in the center (top left plot, black trace). Inverse responses were obtained in the surround. The off-discharge after release of suppression is a useful indicator of the preceding suppression in situations in which the background activity was so low that suppression is not obvious (e.g., M-plus surround, middle left plot, gray trace). In addition to a strong surround response, this cell exhibited strong S-plus responses that coincided in space and sign with the M-plus responses; this is summarized in the diagram at top. Stimulus duration, 73 msec, indicated at the bottom left; stimulus size, 0.9 × 0.9°. This cell was 3° peripheral.

