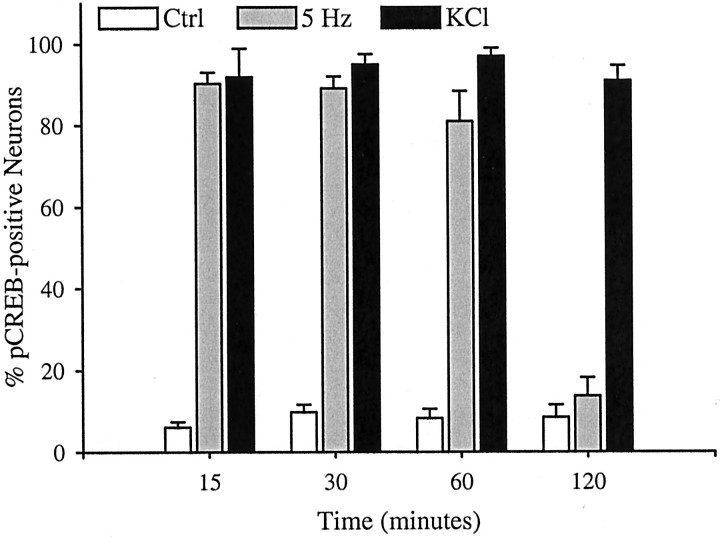
Fig. 8.
Electrical stimulation (5 Hz) and potassium depolarization lead to distinct temporal patterns of CREB phosphorylation. E16.5 PG neurons were stimulated at 5 Hz or with 40 mm KCl for 15, 30, 60, or 120 min. Immediately after the stimulation period, the cultures were fixed and processed for pCREB–NF immunocytochemistry. Each bar represents the percentage of total neurons exhibiting pCREB immunoreactivity. Data are presented as the mean ± SEM. At each time point, except 120 min, 5 Hz and KCl are significantly different from corresponding controls;p ≤ 0.001. At 120 min, only KCl is significantly different from control; p ≤ 0.001.

