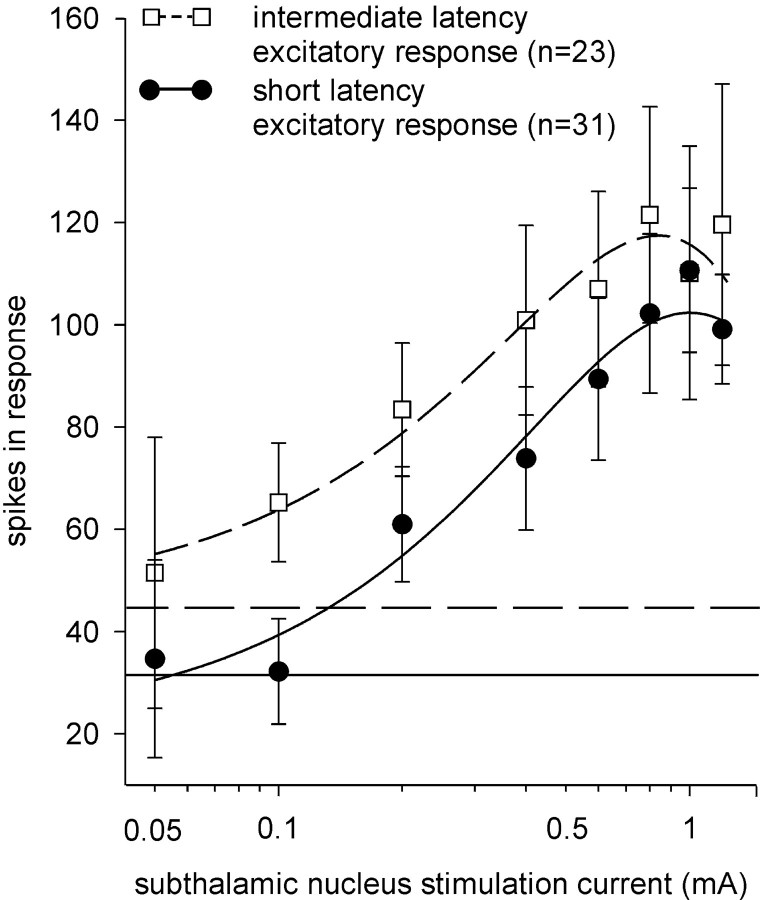
Fig. 5.
The magnitude of the excitatory responses of ventral pallidal neurons increased as the magnitude of the subthalamic stimulation current was increased. Neurons that were monitored during at least three different stimulation current intensities in the range from 0.05 to 1.2 mA were used for this comparison. For each data point in the short latency excitation (SLE) curve (●), there were from 3 to 30 neurons represented (for a total of 31), and 3 to 22 neurons for each data point on the intermediate latency excitation curve (ILE, for a total of 23; ■). The parameters of the response (onset and duration) were determined at a threshold current (defined in Materials and Methods), and these parameters were used to quantify the magnitude (i.e., cT; see Materials and Methods) of the excitatory response obtained with the other stimulation current levels. The duration, as determined at threshold, also was used to quantify baseline. The total number of spikes occurring in the same time frame in the prestimulus period for neurons showing SLE responses (32 ± 5 spikes; mean illustrated by a dashed horizontal line) and ILE responses (44 ± 10 spikes; solid horizontal line) was not significantly different. Increasing the subthalamic stimulation current enhanced spiking frequency in the evoked response component until a maximal effect (Emax) was reached. The SLE responses demonstrated an Emax of ∼100 spikes, and the ILE responses had an Emax of 120 spikes as derived from the peak of the third order polynomial curve fitted to the data. A Student's t test of the response obtained with 0.8 mA was not significantly different. These comparisons indicate that the Emax values for the SLE and ILE curves were similar.

