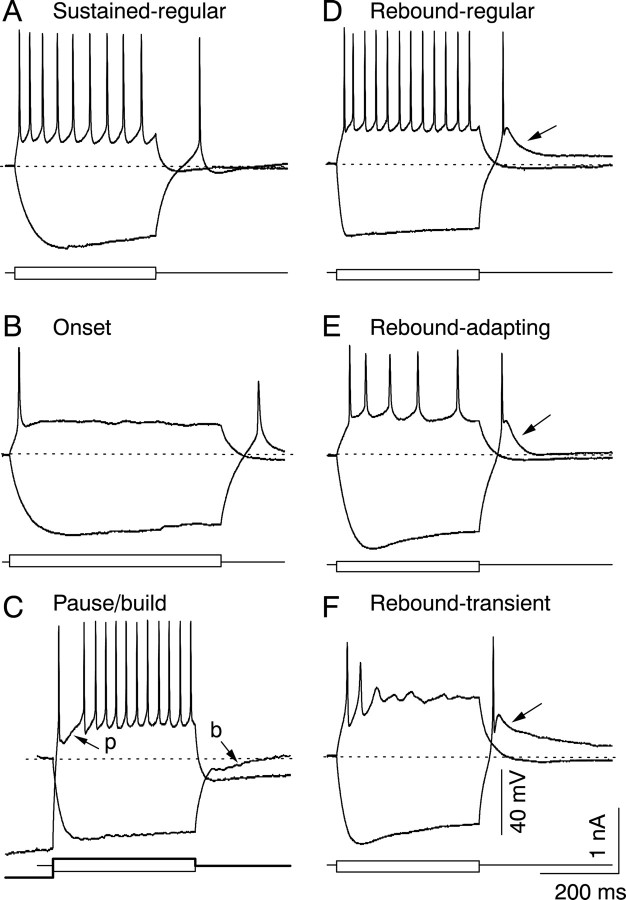
Fig. 13.
The six firing patterns found in the IC. In eachpanel, the bottom two traces are the injected depolarizing and hyperpolarizing current pulses, and thetop two traces are the voltage responses to each current pulse. Dotted lines indicate resting membrane potentials. A, Sustained-regular firing to depolarization with an anode-break spike and no calcium-rebound following hyperpolarization. B, Onset firing to depolarization with an anode-break spike and no calcium-rebound following hyperpolarization. C, Sustained firing to depolarization with a pause–build response after prehyperpolarization and no anode-break spike after hyperpolarization; the thick current trace indicates the current that gave rise to thetop voltage trace, and the thinner current trace is the current that gave rise to the bottom trace. The top voltage trace is the response to an initial prehyperpolarization, followed by a depolarizing current pulse, and begins at the prehyperpolarized value of −90 mV. The cell shows a pause in firing (p) after the first spike. The bottom voltage trace is the response to a hyperpolarizing current pulse and shows the buildup response (b) following hyperpolarization.D, Sustained-regular firing to depolarization with an anode-break sodium spike and a calcium-rebound following the hyperpolarization. E, Sustained firing with adaptation and calcium-sodium rebound activity. F, Transient response to depolarization with calcium-sodium rebound activity.

