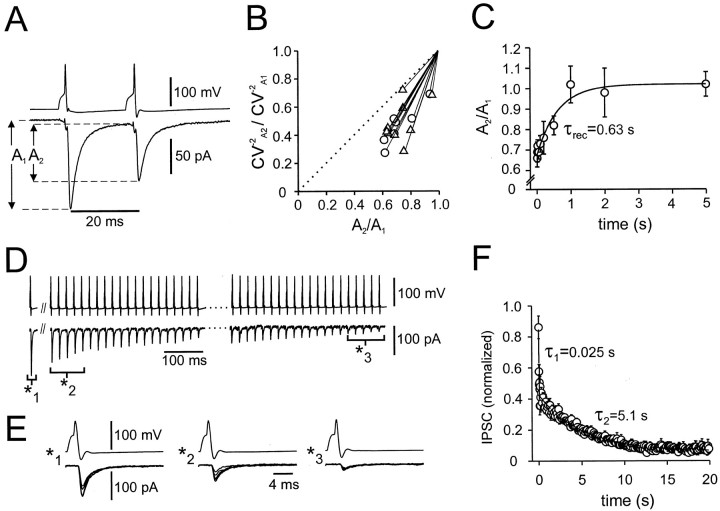
Fig. 2.
Dynamics of transmission at inhibitory BC–BC synapses. A, PPD of IPSCs. IPSCs were evoked by two action potentials in the presynaptic BC, separated by a 20 msec interval. IPSCs shown are averages from 30 single traces (failures included). A1 andA2 were measured from the preceding baseline. B, Coefficient-of-variation analysis of PPD. The inverse of the square of the coefficient of variation (CV−2) of the amplitude of the second IPSC (A2) was plotted against the mean peak amplitude; data were normalized by the CV−2 and mean, respectively, of the amplitude of the first IPSC (A1). Interpulse interval was 20 msec (▵) or 50 msec (○). Dotted line indicates identity line. Data are from 17 pairs.C, Time course of recovery from PPD. Amplitude ratioA2/A1of unitary IPSC was plotted against the interpulse interval. Thecurve represents a fitted monoexponential function with a time constant of 0.63 sec. Data are from 17 pairs. D, Multiple-pulse depression of IPSCs. The bottom trace to the left of the double slash is an average of 10 single sweeps recorded with a stimulation frequency of 0.2 Hz; the traces to the right of thedouble slash are single sweeps (20 events at the onset, 20 events 1 sec after the onset of a 50 Hz train).E, Unitary IPSCs at an expanded time scale from the same pair as shown in D. Five consecutive IPSCs from different times (as indicated by brackets) are shown superimposed. F, Onset of depression during a 50 Hz train. Each data point represents the mean IPSC peak amplitude in three pairs, normalized to the mean peak amplitude at 0.2 Hz (479 pA on average) before the train. Each data point represents a single peak amplitude (first 10 points) or the mean of four amplitudes (all subsequent points). The curve represents the sum of two exponential components and a constant fitted to the data points, with τ1 = 25 msec (A = 0.42), τ2 = 5.1 sec (B = 0.37), and a constant component amplitude of 0.06.

