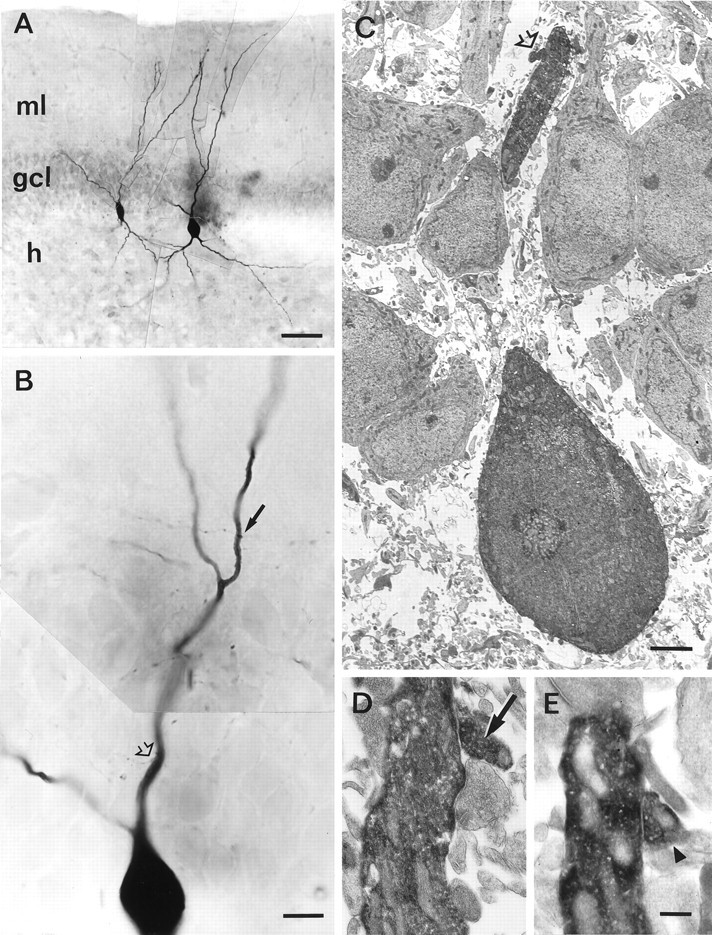
Fig. 4.

Light and correlated electron microscopical analysis of synaptic contacts in a synaptically connected BC–BC pair.A, Low-power light micrograph of the same pair shown in Figure 3. ml, Molecular layer; gcl, granule cell layer; h, hilus. Scale bar, 50 μm.B, High-power light micrograph of the soma and apical dendrite of the postsynaptic BC. Two of the three synaptic contacts in this BC–BC pair are indicated by arrow and open arrow. Scale bar, 10 μm. C, Low-power electron micrograph of the proximal synaptic contact (open arrow). Scale bar, 2.5 μm. D,E, High-power electron micrographs of the two distal contacts (arrow and arrowhead). Contacts indicated by open arrow and arrow inC and D are also visible in the micrograph in B (same symbolic code; contact inE indicated by arrowhead is not shown inB). Scale bar, 0.25 μm.
