Fig. 5.

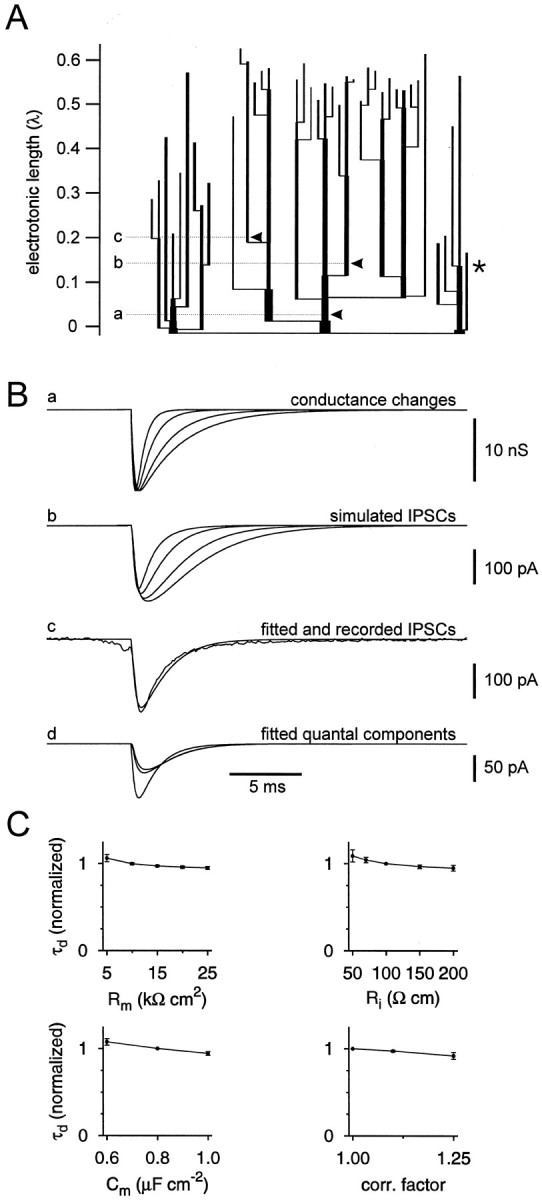
Estimation of the time course of the postsynaptic conductance change at the synaptic contacts. A, Electrotonic dendrogram of a postsynaptic BC (same cell as shown in Figs. 3, 4). Apical dendrites are represented in the center; basal dendrites are shown laterally in the dendrogram. The axon (shown truncated) is indicated by the asterisk; 150 schematic collaterals were attached to the main axon in a distributed manner (not shown). The locations of the synaptic contacts are shown byarrowheads (a, b, c). The physical and electrotonic distances of the three synaptic contacts from the soma were 17, 108, and 133 μm, and 0.03, 0.14, and 0.20 λ, respectively. B, Simulation of IPSCs in voltage-clamp mode. a, Postsynaptic conductance changes, with τrise = 0.2 msec, τdecay = 0.5, 1, 2, and 3 msec, and gmax = 15.8 nS (total conductance change for all sites). b, Resulting simulated IPSCs in the pipette compartment. Conductance changes were generated simultaneously and were assumed to have the same amplitude at all sites. c, Simulated IPSC in the pipette compartment, superimposed with the recorded average unitary IPSC in the same BC–BC pair. The postsynaptic conductance change had a τrise = 0.2 msec, τdecay = 1.02 msec, and gmax = 15.8 nS (total conductance change for all sites), which represent the results of a minimization of the sum of squares of differences between simulated and measured IPSCs. d, Quantal components of the fitted IPSCs in the pipette compartment; same parameters as inc. Note that attenuation and filtering is more pronounced for distal than for proximal sites. C, Exploration of the dependence of the fit results on the parameters of the cable model. The obtained decay time constants (τd) of the conductance change at the postsynaptic site is plotted versusRm,Ri,Cm, and tissue shrinkage correction factor. τd was normalized to the respective value for default parameters (Rm determined individually, Ri = 100 Ω cm, andCm = 0.8 μF/cm2).
