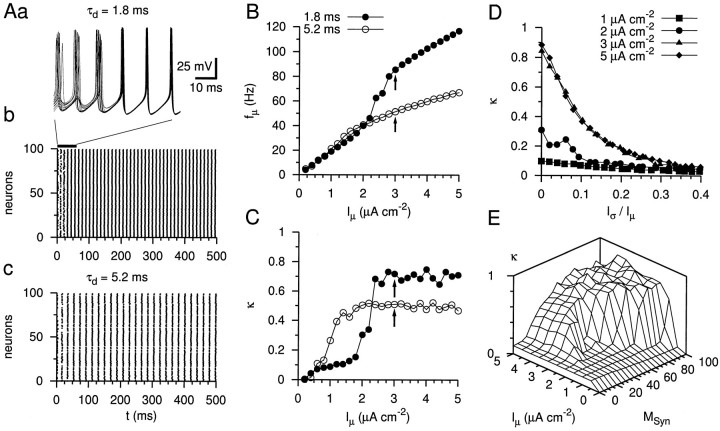
Fig. 8.
Simulation of oscillatory activity in the gamma frequency range in a network of interneurons coupled by fast inhibitory synapses. Aa, Ab, Simulated voltage traces of 15 neurons and rastergram representation of the activity of a network of 100 neurons connected randomly by rapid synapses (synaptic delay 0.8 msec; τd = 1.8 msec;gSyn = 0.02 mS/cm2;MSyn = 60). The excitatory driving current was heterogeneously distributed withIμ = 3 μA/cm2and Iς = 0.09 μA/cm2. Ac, Rastergram of the activity of a network coupled by slow inhibitory synapses (τd = 5.2 msec), as observed at the BC–GC synapse. Note the lower network frequency. Also note that the activity of 13 neurons is suppressed. B, C, Mean network frequency (fμ, B) and coherence (κ, C), plotted against the mean current drive (Iμ,Iς/Iμ = 0.03) for fast (τd = 1.8 msec, ●) and slow decay time constant of the inhibitory postsynaptic conductance change (τd = 5.2 msec, ○). Arrows indicate data points corresponding to the rastergrams shown in Ab and Ac. D, Coherence κ plotted against the heterogeneity measureIς/Iμ of the current drive for Iμ = 1, 2, 3, and 5 μA/cm2 (▪, ●, ▴, and ♦, respectively).E, Plot of network coherence κ versusMSyn and Iμ. Coherence κ increases with both MSyn andIμ. Note that critical values of the two parameters for the generation of coherent oscillations are interdependent.

