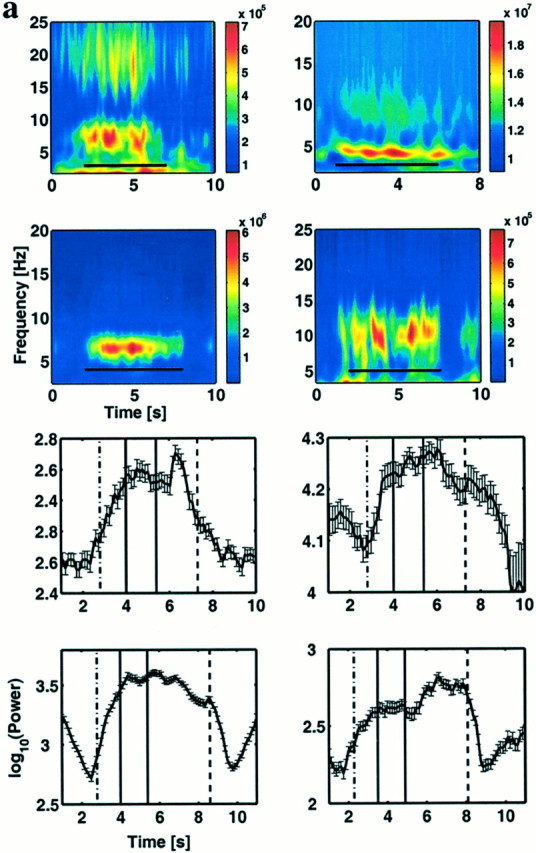
Fig. 3.

Theta is gated during the Sternberg task.a, Time-frequency energy averaged over all two-item lists shows sustained theta activity. An example is shown from each of the four subjects. The data illustrated were obtained from a right frontal site in subject 1 (Talairach coordinates are +44, +11, +38) (top left); a left temporal site in subject 2 (Talairach coordinates are −42, −9, −10) (top right); a right frontal site (Talairach coordinates are −52, −34, +38) in subject 3 (bottom left); and a depth electrode in left temporal lobe (Talairach coordinates are −25, −72, +6) in subject 4 (bottom right). Black bars in the spectrograms denote the trial duration from the orienting cue to the mean response time for two item lists. Because of limitations in our synchronization techniques and methods of time-frequency analysis, the determination of the onset and offset of theta has a precision of ±200 msec. The color scale represents power in square microvolts. In subject 1, we also observed similar gating centered around 18 Hz. However, because this finding was not duplicated across subjects, we did not analyze it further. b, Evolution of average theta power in time for the above four electrodes for a bandwidth of 4 Hz around the peak frequency. The dot–dashed vertical line marks the orienting cue, the two solid lines denote the list items, and thedashed line denotes the probe. Theta power is elevated throughout the trial, with fluctuations within the trial. The error bars denote the 95% confidence intervals.
