
Fig. 7.
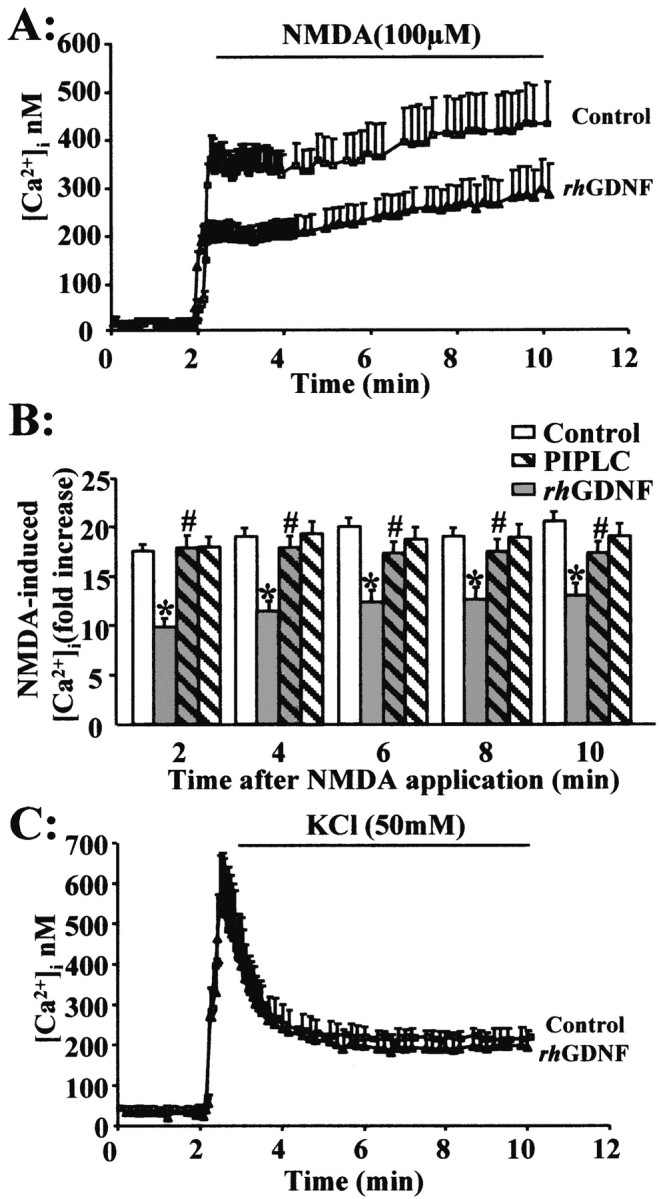
rhGDNF pretreatment reduces the NMDA-evoked calcium increase in cortical neurons. A, Intracellular free Ca2+([Ca2+]i) was measured using fura-2 fluorescence videomicroscopy. Neurons (13–14 DIV) were exposed to a serum-free medium for 45 min in the absence (control, vehicle treated) or presence of rhGDNF (10 ng/ml). Resting [Ca2+ ]i was recorded, and NMDA (100 μm) was applied. [Ca2+]i was measured and analyzed as described in Materials and Methods. B, Representative graph of NMDA-induced Ca2+ response in neurons pretreated with rhGDNF (gray bars) or vehicle (control; white bars) for 45 min. Time course of the effect of rhGDNF on the NMDA-induced [Ca2+] increase, with (hatched bars) or without (unhatched bars) pretreatment with 0.3 IU/ml PIPLC for 2 hr. Data are expressed as an NMDA-induced fold increase in [Ca2+]i. Results represent the mean ± SEM of three separate preparations (3 coverslips; 20 neurons being imaged per coverslip in a single microscopic field). * indicates significantly different from NMDA; # indicates significantly different from NMDA plus GDNF by ANOVA for repeated measures, followed by a Bonferroni–Dunn's test for multiple comparisons (p < 0.05). C, Neurons (13–14 DIV) were exposed to serum-free medium containing MK-801 (10 μm) for 45 min in the absence (control; vehicle treated) or presence of rhGDNF (10 ng/ml). Resting [Ca2+ ]i was recorded, and KCl (50 mm) was applied. Representative graph of KCl-induced Ca2+ response in neurons pretreated with rhGDNF or vehicle (control) for 45 min.